Calculating the QO-100 beacons frequency separation

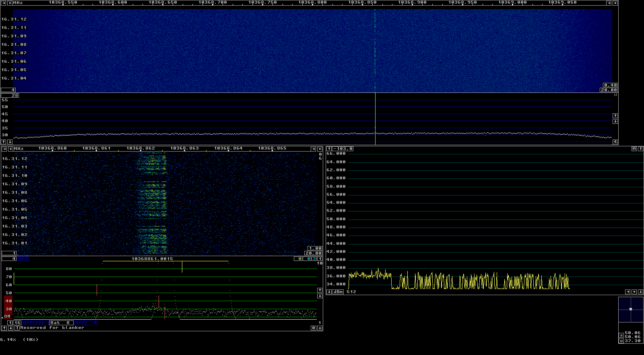
In my previous post I set out to measure the phase difference between the QO-100 8APSK and BPSK beacons. One of the things I mentioned is that the frequency separation between these two beacons was approximately 1.6 Hz larger than the nominal 245 kHz.

A frequency error of a couple of Hz is typical when working with SDRs unless special care is taken. Many SDRs allow choosing the sample rate and centre frequency with great flexibility, but the drawback is that the frequencies that are achieved are often not exactly the ones we indicated. Fractional-N synthesis PLLs are used to generate the sampling clock and local oscillator, so there are small rounding errors in the generated frequencies.

With enough knowledge of how the SDR hardware works and how it is configured, it is possible to determine these frequency errors exactly, as a rational number \(p/q\) that we can calculate explicitly, multiplied by the reference frequency of the SDR. Then we can use this exact value to correct our measurements.

I have asked Mario Lorenz DL5MLO and Kurt Moraw DJ0ABR the details of how the beacons are generated in the Bochum groundstation. Two ADALM Pluto‘s are used: one generates the CW and BPSK beacons, and the other generates the 8APSK multimedia beacon. With the data they have given me, I have been able to compute the frequency separation of the 8APSK and BPSK beacons exactly, and the result matches well my experimental observations.

In this post we will look at how the fractional-N synthesis calculations for the Pluto can be done. Since the Pluto uses an AD9363 RFIC, these calculations are applicable to any product using one of the chips from the AD936x family, and to the FMCOMMS3 evaluation board.

Measuring the QO-100 beacons phase difference

Since a couple months ago, the QO-100 NB transponder has now two digital beacons being transmitted continuously: the “traditional” 400 baud BPSK beacon, and the new 2.4 kbaud 8APSK multimedia beacon. This transponder is an amateur radio bent-pipe linear transponder on board the Es’hail 2 GEO satellite. It has an uplink at 2400.25 MHz, a downlink at 10489.75 MHz, and 500 kHz bandwidth. The two beacons are transmitted from the AMSAT-DL groundstation in Bochum, Germany, with a nominal frequency separation of 245 kHz.

In some posts in the last few years (see this, for instance), I have been measuring the frequency of the BPSK beacon as received by my grounstation in Madrid, Spain. In these frequency measurements we can see the daily Doppler curve of the satellite, which is not completely stationary with respect to the surface of Earth. However, we can also see the frequency variations of the local oscillator of the transponder (including some weird effects called “the wiggles“). For this reason, the frequency of the BPSK beacon is not an ideal measurement for orbit determination, since it is contaminated by the onboard local oscillator.

If we measure the frequency (or phase) of the 8APSK and BPSK beacons and subtract the two measurements, the effects caused by the transponder local oscillator cancel out. The two beacons have slightly different Doppler, because they are not at the same frequency. The quantity that remains after the subtraction is only affected by the movement of the satellite.

Bochum and my station use both references locked to GPS. Therefore, the phase difference of the two beacons gives the group delay from Bochum through the transponder to my station. This indicates the propagation time of the signal, which is often known as three-way range. The three-way range is roughly the sum of distances between the satellite and each groundstation (roughly, but not exactly, due to the light-time delay). It is a quantity that is directly applicable in orbit determination.

In this post I present my first results measuring the phase difference of the beacons and the three-way range.

Trying to observe the Vega-C MEO cubesats

On July 13, the Vega-C maiden flight delivered the LARES-2 passive laser reflector satellite and the following six cubesats to a 5900 km MEO orbit: AstroBio Cubesat, Greencube, ALPHA, Trisat-R, MTCube-2, and CELESTA. This is the first time that cubesats have been put in a MEO orbit (see slide 8 in this presentation). The six cubesats are very similar to those launched in LEO orbits, and use the 435 MHz amateur satellite band for their telemetry downlink (although ALPHA and Trisat-R have been declined IARU coordination, since IARU considers that these missions do not meet the definition of the amateur satellite service).

Communications from this MEO orbit are challenging for small satellites because the slant range compared to a 500 km LEO orbit is about 10 times larger at the closest point of the orbit and 4 times larger near the horizon, giving path losses which are 20 to 12 dB higher than in LEO.

I wanted to try to observe these satellites with my small station: a 7 element UHF yagi from Arrow antennas in a noisy urban location. The nice thing about this MEO orbit is that the passes last some 50 minutes, instead of the 10 to 12 minutes of a LEO pass. This means that I could set the antenna on a tripod and move it infrequently.

As part of the observation, I wanted to perform an absolute power calibration of my SDR (a USRP B205mini) in order to be able to measure the noise power at my location and also the power of the satellite signals power, if I was able to detect them.

Timing SDR recordings with GPS

Following a discussion on Twitter about how to use satellite signals to check that distributed receivers are properly synchronized, I have decided to write a post about how to use GPS signals to timestamp an SDR recording. The idea is simple: we do a short IQ recording of GPS signals, and then process those signals to find the GPS time corresponding to the start of the recording. This can be applied in many contexts, such as:

  • Checking if the 1PPS synchronization in an SDR receiver is working correctly.
  • Timestamping an SDR recording without the need of a GPS receiver or 1PPS input, by first recording GPS signals for some seconds and then moving to the signals of interest (this only works if you’re able to change frequency without stopping the sample stream).
  • Measuring hardware delays between the 1PPS input and the ADC of an SDR (for this you need to know the hardware delay between the antenna connector and 1PPS output of your GPSDO).
  • Checking if synchronization is repetitive across restarts or power cycles.

We will do things in a fairly manual way, using a couple of open source tools and a Jupyter notebook. The procedure could certainly be automated more (but if you do so, at some point you might end up building a full fledged GPS receiver!). The post is written with a walk-through approach in mind, and besides the usefulness of timestamping recordings, it is also interesting to see hands-on how GPS works.

Radiometry for DELFI-PQ, EASAT-2 and HADES

On January 13, the SpaceX Transporter-3 mission launched many small satellites into a 540 km sun-synchronous orbit. Among these satellites were DELFI-PQ, a 3U PocketQube from TU Delft (Netherlands), which will serve for education and research, and EASAT-2 and HADES, two 1.5U PocketQubes from AMSAT-EA (Spain), which have FM repeaters for amateur radio. The three satellites were deployed close together with an Albapod deployer from Alba orbital.

While DELFI-PQ worked well, neither AMSAT-EA nor other amateur operators were able to receive signals from EASAT-2 or HADES during the first days after launch. Because of this, I decided to help AMSAT-EA and use some antennas from the Allen Telescope Array over the weekend to observe these satellites and try to find more information about their health status. I conducted an observation on Saturday 15 and another on Sunday 16, both during daytime passes. Fortunately, I was able to detect EASAT-2 and HADES in both observations. AMSAT-EA could decode some telemetry from EASAT-2 using the recordings of these observations, although the signals from HADES were too weak to be decoded. After my ATA observations, some amateur operators having sensitive stations have reported receiving weak signals from EASAT-2.

AMSAT-EA suspects that the antennas of their satellites haven’t been able to deploy, and this is what causes the signals to be much weaker than expected. However, it is not trivial to see what is exactly the status of the antennas and whether this is the only failure that has happened to the RF transmitter.

Readers are probably familiar with the concept of telemetry, which involves sensing several parameters on board the spacecraft and sending this data with a digital RF signal. A related concept is radiometry, where the physical properties of the RF signal, such as its power, frequency (including Doppler) and polarization, are directly used to measure parameters of the spacecraft. Here I will perform a radiometric analysis of the recordings I did with the ATA.

Waterfalls from the December 2021 eclipse frequency measurement

The HamSci Ham Radio Scienze Citizen Investigation community organized earlier this month the December 2021 Eclipse Festival of Frequency Measurement. The goal of this activity was to measure the frequency of HF time signals such as WWV and RWM over the course of ten days. The experiment lasted from December 1 to December 10, so it included the total eclipse over Antarctica of December 4, which happened between 5:29 and 9:37 UTC.

I participated in this activity with my HF station, which consists of a Hermes-Lite 2 beta2 DDC/DUC SDR transceiver and an end-fed random wire antenna about 17 metres long. I used a 10 MHz reference from a GPSDO as described in this post to lock the Hermes-Lite 2 sampling clock. Instead of measuring frequency in real time, I recorded IQ data at 200 sps for the WWV carrier at 5000, 10000 and 15000 kHz and for the RWM carrier at 4996, 9996 and 14996 kHz, so that the data could be post processed later with any kind of algorithms. I have published my recordings in the “December 2021 Eclipse Festival of Frequency Measurment IQ recording by station EA4GPZ” dataset in Zenodo.

In this post I process the IQ recordings to produce waterfalls that give us an overview of the data. The frequency measurement will be done in a later post.

Imaging Cygnus A at 8.45 GHz with ATA

Earlier this year, I published a post showing our results of the interferometric imaging of Cassiopeia A and Cygnus A at 4.9 GHz with the Allen Telescope Array. Near the end of July, I decided to perform more interferometric observations of Cygnus A at a higher frequency, in order to obtain better resolution. I chose a frequency of 8.45 GHz because it is usually a band clean of interference (since it is allocated to deep space communications), it is used by other radio observatories, so flux densities can be compared directly with previous results, and because going higher up in frequency the sensitivity of the old feeds at ATA starts to decrease.

This post is a summary of the observations and results. The code and data is included at the end of the post.

Rain backscatter on 10 GHz

Yesterday we had a strong storm in Madrid at around 16:30 UTC. The storm was rather short but intense. Seeing the heavy rain, it occurred to me that I might be able to receive the 10 GHz beacon ED4YAE at Alto del León using my QO-100 groundstation (without moving the antenna).

The 10 GHz beacon is 39.4 km away and the direct path to my station is obstructed by some hill in the middle, as shown in the link profile.

Link profile ED4YAE -> EA4GPZ (from HeyWhatsThat.com)

In the countryside just outside town it is possible to receive the beacon, probably because it diffracts on the hills. However, it is impossible for me to receive it directly from home, as there are too many tall buildings in the way.

In fact, when I fired up my receiver as the storm raged, I was able to see the beacon signal, with a huge Doppler spread of some 700 Hz (20 m/s). The CW ID of the beacon was easy to copy.

ED4YAE -> EA4GPZ at 10 GHz via rain backscatter

Then I started recording the signal. As the rain got weaker, it started disappearing, until it faded away completely. This post is a short analysis of the scatter geometry and the recording.

GPS spectrometry at Allen Telescope Array

Over the last few weeks I have been helping the Allen Telescope Array by calibrating the pointing of some of the recently upgraded antennas using the GNU Radio backend, which consists of two USRP N32x devices that are connected to the IF output of the RFCB downconverter. For this calibration, GPS satellites are used, since they are very bright, cover most of the sky, and have precise ephemerides.

The calibration procedure is described in this memo. Essentially, it involves pointing at a few points that describe a cross in elevation and cross-elevation coordinates and which is centred at the position of the GPS satellite. Power measurements are taken at each of these points and a Gaussian is fitted to compute the pointing error.

The script I am using is based on this script for the CASPER SNAP boards, with a few modifications to use my GNU Radio polarimetric correlator, which uses the USRPs and a software FX correlator that computes the crosscorrelations and autocorrelations of the two polarizations of two antennas. For the pointing calibration, only the autocorrelations are used to measure Stokes I, but all the correlations are saved to disk, which allows later analysis.

In this post I analyse the single-dish polarimetric spectra of the GPS satellites we have observed during some of these calibrations.

QO-100 spring eclipse season

A few days ago, the spring eclipse season for Es’hail 2 finished. I’ve been recording the frequency of the NB transponder BPSK beacon almost 24/7 since March 9 for this eclipse season. In the frequency data, we can see that, as the spacecraft enters the Earth shadow, there is a drop in the local oscillator frequency of the transponder. This is caused by a temperature change in the on-board frequency reference. When the satellite exits the Earth shadow again, the local oscillator frequency comes back up again.

The measurement setup I’ve used for this is the same that I used to measure the local oscillator “wiggles” a year ago. It is noteworthy that these wiggles have completely disappeared at some point later in 2020 or in the beginning of 2021. I can’t tell exactly when, since I haven’t been monitoring the beacon frequency (but other people may have been and could know this).

A Costas loop is used to lock to the BPSK beacon frequency and output phase measurements at a rate of 100 Hz. These are later processed in a Jupyter notebook to obtain frequency measurements with an averaging time of 10 seconds. Some very simple flagging of bad data (caused by PLL unlocks) is done by dropping points for which the derivative exceeds a certain threshold. This simple technique still leaves a few bad points undetected, but the main goal of it is to improve the quality of the plots.

The figure below shows the full time series of frequency measurements. Here we can see the daily sinusoidal Doppler pattern, and long term effects both in the orbit and in the local oscillator frequency.

If we plot all the days on top of each other, we get the following. The effect of the eclipse can be clearly seen between 22:00 and 23:00 UTC.

By adding an artificial vertical offset to each of the traces, we can prevent them from lying on top of each other. We have coloured in orange the measurements taken when the satellite was in eclipse. The eclipse can be seen getting shorter towards mid-April and eventually disappearing.

We see that the frequency drop starts exactly as soon as the eclipse starts. In many days, the drop ends at the same time as the eclipse, but in other days the drop ends earlier and we can see that the orange curve starts to increase again near the end of the eclipse. This can be seen better in the next figure, which shows a zoom to the time interval when the eclipse happens, and doesn’t apply a vertical offset to each trace. I don’t have an explanation for this increase in frequency before the end of the eclipse.

The plots in this post have been done in this Jupyter notebook. The frequency measurements have been stored in this netCDF4 file, which can be loaded with xarray.