Maia SDR

I’m happy to announce the release of Maia SDR, an open-source FPGA-based SDR project focusing on the ADALM Pluto. The first release provides a firmware image for the Pluto with the following functionality:

  • Web-based interface that can be accessed from a smartphone, PC or other device.
  • Real-time waterfall display supporting up to 61.44 Msps (limit given by the AD936x RFIC of the Pluto).
  • IQ recording in SigMF format, at up to 61.44 Msps and with a 400 MiB maximum data size (limit given by the Pluto RAM size). Recordings can be downloaded to a smartphone or other device.

Calculating the QO-100 beacons frequency separation

In my previous post I set out to measure the phase difference between the QO-100 8APSK and BPSK beacons. One of the things I mentioned is that the frequency separation between these two beacons was approximately 1.6 Hz larger than the nominal 245 kHz.

A frequency error of a couple of Hz is typical when working with SDRs unless special care is taken. Many SDRs allow choosing the sample rate and centre frequency with great flexibility, but the drawback is that the frequencies that are achieved are often not exactly the ones we indicated. Fractional-N synthesis PLLs are used to generate the sampling clock and local oscillator, so there are small rounding errors in the generated frequencies.

With enough knowledge of how the SDR hardware works and how it is configured, it is possible to determine these frequency errors exactly, as a rational number \(p/q\) that we can calculate explicitly, multiplied by the reference frequency of the SDR. Then we can use this exact value to correct our measurements.

I have asked Mario Lorenz DL5MLO and Kurt Moraw DJ0ABR the details of how the beacons are generated in the Bochum groundstation. Two ADALM Pluto‘s are used: one generates the CW and BPSK beacons, and the other generates the 8APSK multimedia beacon. With the data they have given me, I have been able to compute the frequency separation of the 8APSK and BPSK beacons exactly, and the result matches well my experimental observations.

In this post we will look at how the fractional-N synthesis calculations for the Pluto can be done. Since the Pluto uses an AD9363 RFIC, these calculations are applicable to any product using one of the chips from the AD936x family, and to the FMCOMMS3 evaluation board.

Timing SDR recordings with GPS

Following a discussion on Twitter about how to use satellite signals to check that distributed receivers are properly synchronized, I have decided to write a post about how to use GPS signals to timestamp an SDR recording. The idea is simple: we do a short IQ recording of GPS signals, and then process those signals to find the GPS time corresponding to the start of the recording. This can be applied in many contexts, such as:

  • Checking if the 1PPS synchronization in an SDR receiver is working correctly.
  • Timestamping an SDR recording without the need of a GPS receiver or 1PPS input, by first recording GPS signals for some seconds and then moving to the signals of interest (this only works if you’re able to change frequency without stopping the sample stream).
  • Measuring hardware delays between the 1PPS input and the ADC of an SDR (for this you need to know the hardware delay between the antenna connector and 1PPS output of your GPSDO).
  • Checking if synchronization is repetitive across restarts or power cycles.

We will do things in a fairly manual way, using a couple of open source tools and a Jupyter notebook. The procedure could certainly be automated more (but if you do so, at some point you might end up building a full fledged GPS receiver!). The post is written with a walk-through approach in mind, and besides the usefulness of timestamping recordings, it is also interesting to see hands-on how GPS works.

Ranging through the QO-100 WB transponder

One of the things I’ve always wanted to do since Es’hail 2 was launched is to perform two-way ranging by transmitting a signal through the Amateur transponder and measuring the round trip time. Stefan Biereigel DK3SB first did this about a year ago. His ranging implementation uses a waveform with a chip rate of only 10kHz, as it is thought for Amateur transponders having bandwidths of a few tens of kHz. With this relatively slow chiprate, he achieved a ranging resolution of approximately 1km.

The QO-100 WB transponder allows much wider signals that can be used to achieve a ranging resolution of one metre or less. This weekend I have been doing my first experiments about ranging through the QO-100 WB transponder.

Angle of arrival experiment in 145MHz

On April 28, I got together with a few Spanish radio Amateurs to perform some experiments. One of the things we did was an angle of arrival experiment in the 145MHz Amateur band. The ultimate goal of the experiment was to be able to measure the angle of arrival of meteor reflections of the GRAVES radar at 143.05MHz. However, we also recorded a few other signals, such as the Amateur satellite band at 145.9MHz (intended to perform calibration of the setup) and the APRS terrestrial signals at 144.8MHz.

Detecting the Sprites from KickSat-2

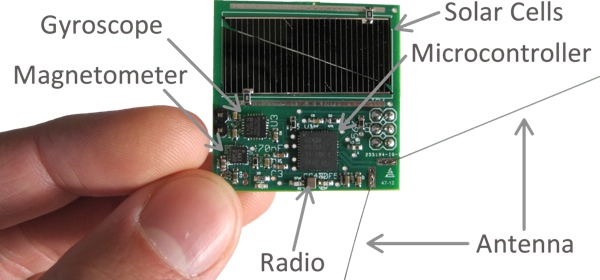
The Sprites chipsats are tiny satellites built on a 3.5×3.5cm PCB with the bare minimum electronics to do something useful: a CC430 microcontroller with integrated FSK transceiver, an IMU, and solar cells.

Sprite chipsat (taken from the KickSat webpage)

The Sprites have been developed as part of the KickSat project, led by Zac Manchester, from Stanford University. The idea is to carry up to 128 Sprites in a cubesat and deploy them in a swarm once the cubesat is in orbit. The first test of this concept was done by the KickSat 3U cubesat in 2014. The test was a failure, since the Sprites couldn’t be deployed before KickSat reentered.

The second test was made this year with the KickSat-2 3U cubesat, a reflight of the KickSat mission carrying 104 Sprites. KickSat-2 was launched to the ISS onboard Cygnus NG-10 in November 2018 and deployed into orbit in February 2019.

On March 19, the Sprites were successfully deployed from KickSat-2, as Zac announced in Twitter, requesting help from the Amateur radio community to receive the signals from the Sprites at 437.240MHz. On March 22, Cees Bassa and Tammo Jan Dijkema tried to detect the Sprites by doing a planar scan with the Dwingeloo 25m radiotelescope. They were successful, detecting several transmissions from the Sprites in the waterfall. At that moment, the Sprites were up to 5 minutes ahead KickSat-2, due to their much higher drag to mass ratio. They all probably reentered a few days after this.

All the Sprites transmit in the same frequency using CDMA, so further analysis is required to identify which Sprites were observed by Dwingeloo. Zac said he was working on decoding the recording, however, I haven’t seen any results published yet. Here I show my analysis of the recording made at Dwingeloo. I manage to detect 4 different Sprites.

Report for today’s DSLWP-B SSDV session

Today an SSDV transmission session from DSLWP-B was programmed between 7:00 and 9:00 UTC. The main receiving groundstation was the Dwingeloo radiotelescope. Cees Bassa retransmitted the reception progress live on Twitter. Since the start of the recording, it seemed that some of the SSDV packets were being lost. As Dwingeloo gets a very high SNR and essentially no bit errors, any lost packets indicate a problem either with the transmitter at DSLWP-B or with the receiving software at Dwingeloo.

My analysis of last week’s SSDV transmissions spotted some problems in the transmitter. Namely, some packets were being cut short. Therefore, I have been closely watching out the live reports from Cees Bassa and Wei Mingchuan BG2BHC and then spent most of the day analysing in detail the recordings done at Dwingeloo, which have been already published here. This is my report.

K2SAT S-band image receiver

K2SAT is a cubesat developed by the Aeroespace Systems and Control Lab in KAIST, a university in Daejeon, South Korea. It will be launched later this year, between September and October. The main mission of the satellite is to test the transmission of images taken with its onboard camera using an S-band QPSK transmitter that supports up to 2Mbps data rate. This will use the 2.4GHz Amateur satellite band, and the satellite has already coordinated a downlink frequency of 2404MHz. The K2SAT team at KAIST is the same one that built the QB50 KR01 (LINK) cubesat.

Since February, I have been collaborating with Pilwon Kwak and the rest of the K2SAT team to produce a GNU Radio receiver for the S-band image downlink and add it to my gr-satellites project. This receiver has now been publicly released. Here I explain the main details of the transmitter and protocol used by K2SAT and the implementation of the receiver.

First FT8 test through FO-29

Continuing with my research on using WSJT-X modes through linear transponder satellites in low Earth orbit (see part I and part II), a few days ago I transmitted and recorded an FT8 signal through the V/U linear transponder on FO-29 during a complete pass. The recording started at 2017/10/23 20:26:00 UTC and ended at 20:42:30 UTC. It was made with a FUNcube Dongle Pro+ set to a centre frequency of 435.850MHz and connected to a handheld Arrow satellite yagi through a duplexer. Here the duplexer was used to avoid desense on transmit.

An FT8 signal was transmitted on every even period during the recording, at a fixed frequency of 145.990MHz, using a Yaesu FT-817ND and the Arrow antenna. The signal was transmitted using lower sideband (i.e., inverted in the frequency domain) to get a correct FT8 signal through the inverting transponder. The transmit power was adjusted often to get a reasonable signal through the transponder and avoid using excessive power. There have been reports and complaints of people using too much power with digital modes through linear satellites. In this post, a study of the power is included to show that it is possible to use digital modes effectively without putting any pressure on the satellite’s transponder.

Out of the 33 even periods, a total of 24 can be decoded by WSJT-X using the best TLEs from Space-Track. No measures were taken to correct for the time offset \(\delta\) that has been studied in the previous posts, as the TLEs already provided a good Doppler correction. Regarding the choice of TLEs, there are still some remarks to make. First, the epoch of the TLEs used was 2017/10/23 21:39:16 UTC, so these TLEs were actually taken after the pass. The previous TLEs were taken a few hours before the pass, and it is likely that they also provided a good correction, perhaps by using a time offset \(\delta\) if necessary. However, I do not know if these previous TLEs were also available from CelesTrak before the start of the pass, as it seems that TLEs take a while to propagate from Space-Track to Celestrack. To explain why the TLEs with no time offset correction are enough, it will be interesting to study the rate of change of TLE parameters for FO-29. This will be done in a future post.

The results of this test look very promising. Even though this wasn’t an overhead pass (the maximum elevation was 40º), the maximum rate of change of the Doppler was over 20Hz/s for the self-Doppler seen on the FT8 signal and 35Hz/s for the downlink Doppler seen on the CW beacon. Most of the periods which couldn’t be decoded were near the start or end of the pass. This is the only test that I know of that has decoded FT8 signals in the presence of high rates of change of Doppler. The previous tests by other people were made at low elevations, where the rate of change of Doppler is small. This test has shown that it is possible to get many decodes with high rates of change of Doppler, even using no corrections to the TLEs. Here I continue with a detailed analysis of the recording.

Polarization in Voyager signal from Green Bank Telescope

A few days ago I read the paper about the Breakthrough Listen experiment. This experiment consists in doing many wideband recordings of different stars using the Green Bank Telescope, and (in the future) Parkes Observatory and then trying to find signals from extraterrestrial intelligent life in the recordings. The Breakthrough Listen project has a nice Github repository with some documentation and an analysis of a recording they did of Voyager 1 to test their setup.

I have also been thinking about how to study the polarization of signals in a dual polarization recording (two coherent channels with orthogonal polarizations). My main goal for this is to study the polarization of the signals of Amateur satellites in low Earth orbit. It seems that there are many myths regarding polarization and the rotation of cubesats, and these myths eventually pop up whenever anyone tries to discuss whether linearly polarized or circularly polarized Yagis are any good for receiving cubesats.

Through the Breakthrough Listen paper I’ve learned of the Stokes parameters. These are a set of parameters to describe polarization which are very popular in optics, since they are easy to measure physically. I have immediately noticed that they are also easy to compute from a dual polarization recording. In comparison with Jones vectors, Stokes parameters disregard all the information about phase, but instead they are computed from the averaged power in different polarizations. This makes their computation less affected by noise and other factors.

As I also wanted to get my hands on the Breakthrough Listen raw recordings, I have been computing the Stokes parameters of the Voyager 1 signal in their recording. Since the Voyager 1 signal is left hand circularly polarized, the results are not particularly interesting. It would be better to use a signal with changing polarization or some form of elliptical polarization.

I have started to use Jupyter notebook. This is something I had been wanting to try since a while ago, and I’ve realised that a Jupyter notebook serves better to document my experiments in Python than a Python script in a gist, which is what I was doing before. I have started a Github repo for my experiments using Jupyter notebooks. The experiment about polarization in the Voyager 1 signal is the first of them. Incidentally, this experiment has been done near Voyager 1’s 40th anniversary.