The Sprites chipsats are tiny satellites built on a 3.5×3.5cm PCB with the bare minimum electronics to do something useful: a CC430 microcontroller with integrated FSK transceiver, an IMU, and solar cells.
The Sprites have been developed as part of the KickSat project, led by Zac Manchester, from Stanford University. The idea is to carry up to 128 Sprites in a cubesat and deploy them in a swarm once the cubesat is in orbit. The first test of this concept was done by the KickSat 3U cubesat in 2014. The test was a failure, since the Sprites couldn’t be deployed before KickSat reentered.
The second test was made this year with the KickSat-2 3U cubesat, a reflight of the KickSat mission carrying 104 Sprites. KickSat-2 was launched to the ISS onboard Cygnus NG-10 in November 2018 and deployed into orbit in February 2019.
On March 19, the Sprites were successfully deployed from KickSat-2, as Zac announced in Twitter, requesting help from the Amateur radio community to receive the signals from the Sprites at 437.240MHz. On March 22, Cees Bassa and Tammo Jan Dijkema tried to detect the Sprites by doing a planar scan with the Dwingeloo 25m radiotelescope. They were successful, detecting several transmissions from the Sprites in the waterfall. At that moment, the Sprites were up to 5 minutes ahead KickSat-2, due to their much higher drag to mass ratio. They all probably reentered a few days after this.
All the Sprites transmit in the same frequency using CDMA, so further analysis is required to identify which Sprites were observed by Dwingeloo. Zac said he was working on decoding the recording, however, I haven’t seen any results published yet. Here I show my analysis of the recording made at Dwingeloo. I manage to detect 4 different Sprites.
The Dwingeloo IQ recording can be downloaded here. It is an 11 minute recording at 500ksps centred on 437.350MHz. The first step in processing this recording is to translate it in frequency and decimate it. Since the Sprites use GMSK direct sequence spread spectrum at 64kchips/s, I decimate by 5 to obtain a 100ksps IQ file centred at 437.240MHz. This is done using this simple GNU Radio flowgraph.
The PRNs used for CDMA are Gold codes of length 511. The M-sequences used to generate the Gold codes can be found in the gr-sprite GNU Radio decoder. The PRN is enlarged to 512 chips by appending an additional chip at the end. Since the chiprate is 64kchips/s, this means that PRNs are repeated at a rate of 125Hz. Transmission of data is done by switching between two different PRNs to encode different symbols. Therefore, the symbol rate is 125syms/s. Each Sprite has allocated a pair of PRNs with consecutive index. There is a list of the PRN allocations, but it seems it doesn’t cover the KickSat-2 Sprites. These two PRNs are used to encode the symbols 0 and 1. The modulation is GMSK. The PRNs are sent directly in GMSK, with no precoding. Interestingly, the bit 0 is encoded by the high tone, and the bit 1 encoded by the low tone.
My analysis of the recording is based on a correlation algorithm against replicas generated for each of the PRNs. I use OQPSK (with no bit shaping) to generate the replicas. The duration of each replica is 511 chips. This amounts to 798 samples at a sample rate of 100ksps, so I use an FFT size of 2048 to do the correlations.
I take 2048 samples of signal and pad the replica with zeros to do the correlation using an FFT. Only the first 1024 delays are used to evaluate the correlation. This is done to make sure that a complete PRN fits inside the window of 2048 samples. This window is scanned along the recording by advancing it in steps of 1024 samples, so that each PRN in the signal has a single chance of appearing in one of these correlations (and it appears completely inside the corresponding 2048 sample window). Search in frequency is done by using circular shifting in the frequency domain.
This correlation algorithm is computationally expensive, since it tries to correlate against each of the 511 different Gold codes, as well as the two M-sequences that generate the code (It is not clear if these could be used in a Sprite. The GNU Radio decoder lists them as PRNs -1 and -2). Scanning against the full frequency range in the recording (+-50kHz) is prohibitive. Thus, by some trial and error with the strongest signals, I have determined that the signals are centred around 10.5kHz (so higher in frequency than expected). I scan only +-2kHz around this value. This amounts to 83 frequency bins.
Taking everything into account, the correlation against the complete recording amounts to more than 2.8 thousand million FFTs of 2048 samples. The algorithm took nearly 58 hours to run in my i7-2620M CPU, using dask for parallelization. This means that my machine is doing 13800 FFTs per second. The FFT is done using the standard dask FFT function. Perhaps a faster FFT library, such as pyFFTW would improve things.
The results of the algorithm are saved in HDF5 format in this file (392MB). It stores, for each correlation window and each PRN, the magnitude of the best correlation, and the corresponding frequency and delay.
Interpreting the results is not so easy, because the CMDA coding gain is only 27dB, and since the signals are strong, they correlate against all the PRNs, because they have nonzero cross-correlation. Thus, I have introduced a heuristic called “cross-correlation threshold”. For each time window, this is the 90% percentile of the correlation with each of the PRNs. The figure below shows how this magnitude stays around -35dB most of the time, but grows up to 25dB whenever a strong transmission occurs.

My first task is to try to detect which PRNs are present in the recording. To do this, for each PRN, I divide the correlation by the cross-correlation threshold and plot the maximum value in all the recording. This is shown in the figure below, with red dots marking the 10 largest values, which will be examined further.
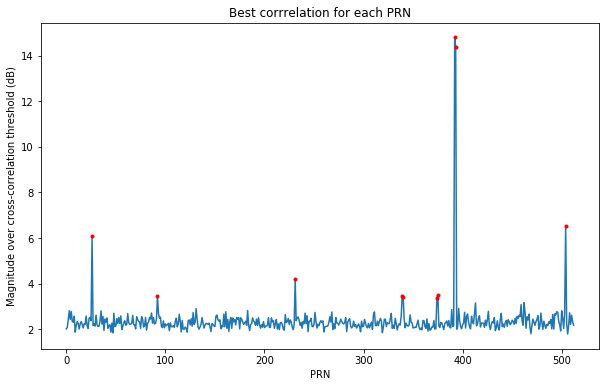
The two largest points correspond to PRNs 392 and 393. As we will see, these correspond to a Sprite that transmitted several complete messages by toggling between its two allocated PRNs. However, the remaining red points need to be filtered for false detections.
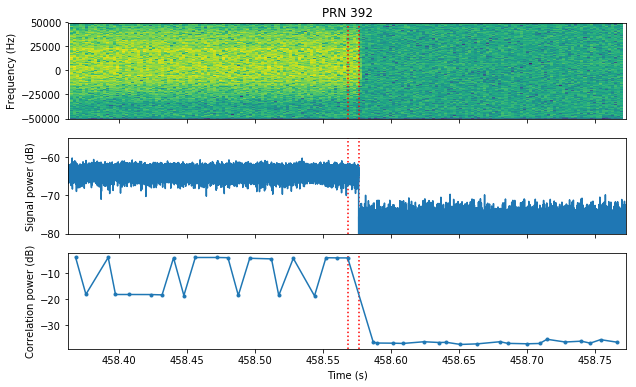
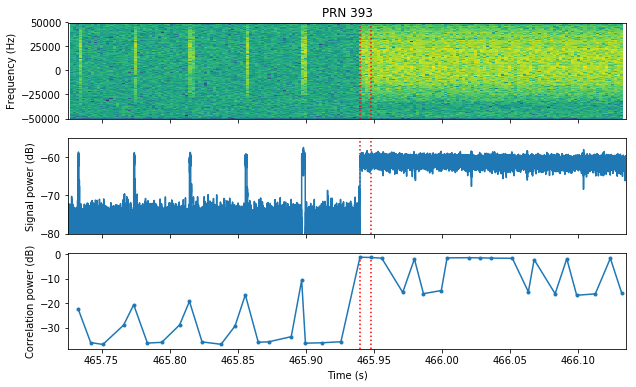
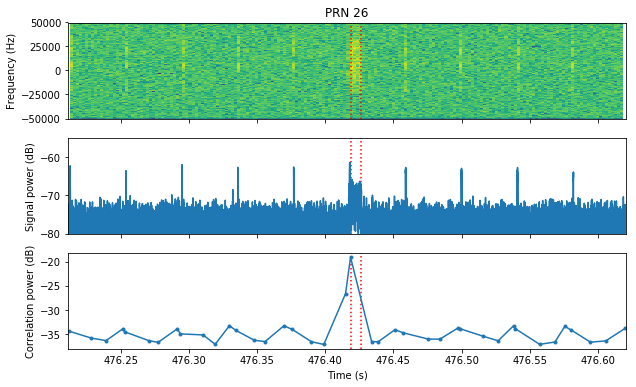
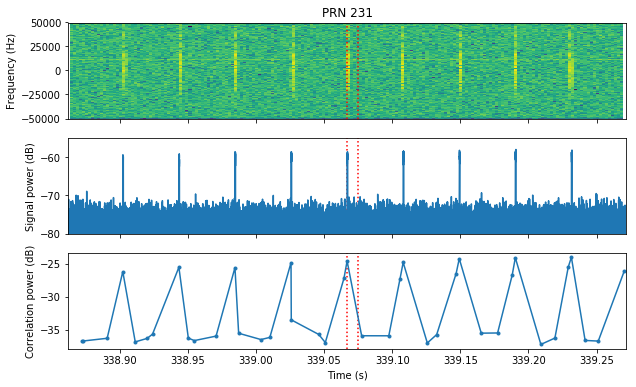
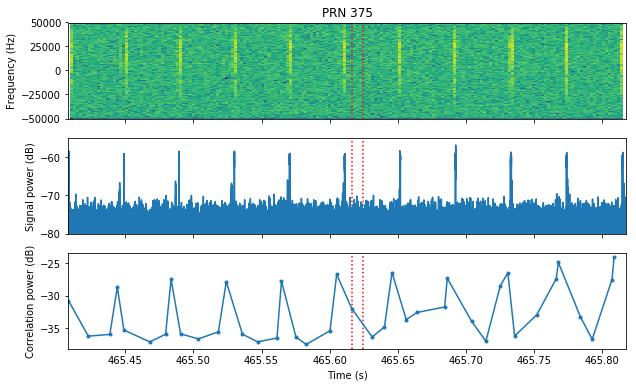
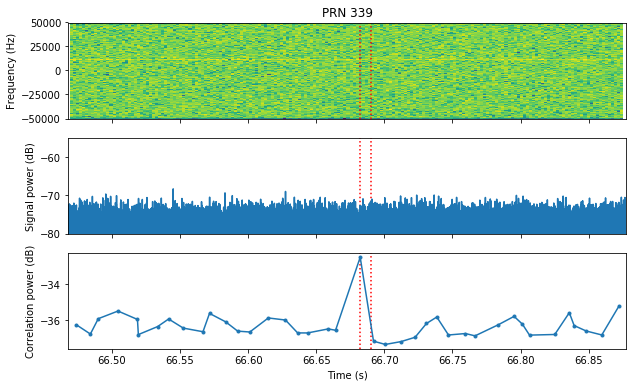
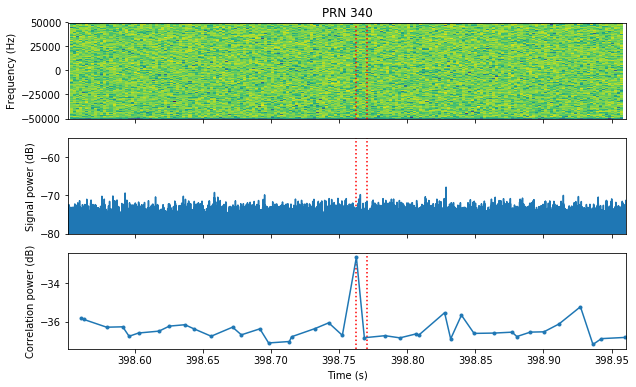
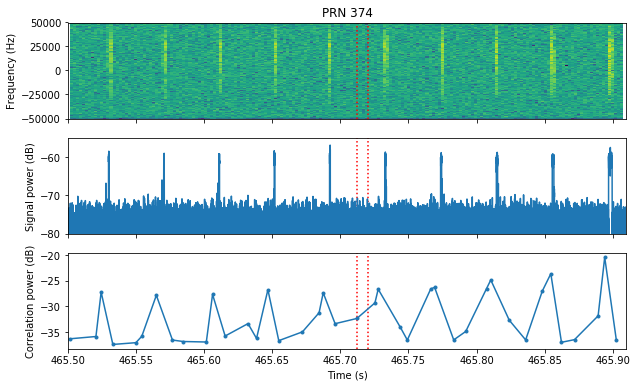
To do so, for each of the of these PRNs, we plot the signal around the moment in time that caused the best correlation, as shown in the figure above. We plot the spectrum and power of the signal, as well as the correlation power. The moment in time where the PRN was detected appears marked between red dotted lines. This is shown in the plots below, which are ordered in terms of decreasing correlation magnitude.
For PRNs 392 and 393 we see that the detections are clear and correspond to symbols inside a complete message.
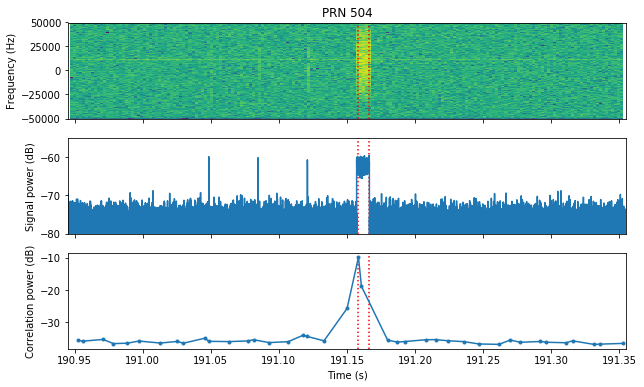
On the other hand, PRN 504 was detected using a single symbol that doesn’t belong to a complete message.
In the case of PRN 26, it is also detected with a single symbol, but there are also very short transmissions of a few chips. These correspond to another PRN, since they do not register in the correlation against PRN 26.
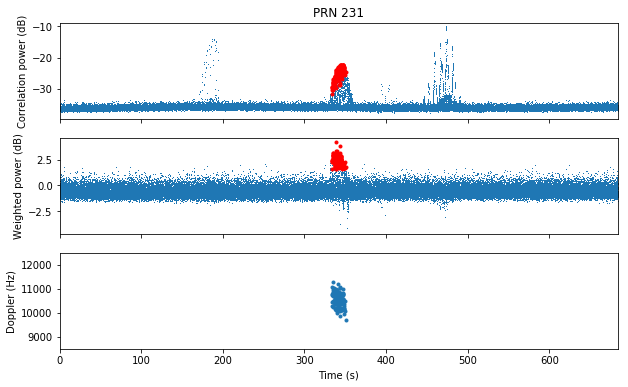
PRN 231 is detected by using very short transmissions of a few chips. Despite the fact that the transmissions are very short, the signal is so strong that we have more than 10dB of correlation SNR.
PRN 375 is a false detection, since the detection doesn’t align correctly to the short transmissions.
PRNs 339 and 340 are false detections in Gaussian noise. There are no transmissions where the detection happened.
PRN 374 is also a false detection, since the short bursts don’t align with the detection.
Thus, only 5 of our 10 candidate detections are valid. It is interesting to observe that often we see short transmissions which are smaller than one symbol. As far as I know, each Sprite should transmit a complete message which lasts several symbols. Therefore, shorter transmissions probably indicate that the transmission failed due to lack of power. As soon as the transmission started, the bus voltage dropped and the transmission stopped. It is also interesting to note that despite the large number of sprites launched, only 4 of them have been successfully detected. This seems to indicate that the failure ratio of these Sprites is very high.
Now we turn to study the 5 PRNs corresponding to valid detections. For these, we say that a correlation corresponds to a detection if the following three conditions are met for this time window:
- This PRN has the highest correlation among all PRNs for this time window
- The correlation magnitude is greater than certain threshold
- The correlation magnitude, weighted with the cross-correlation threshold, is greater than a certain threshold
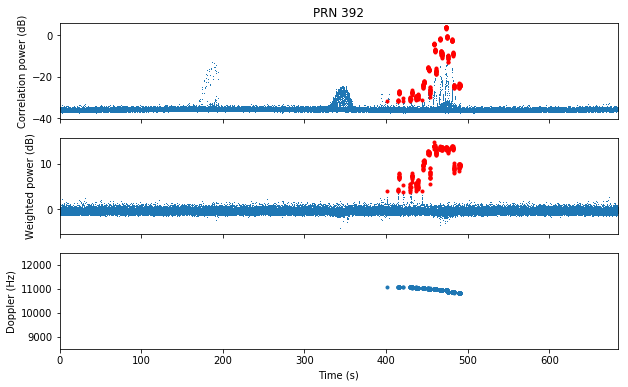
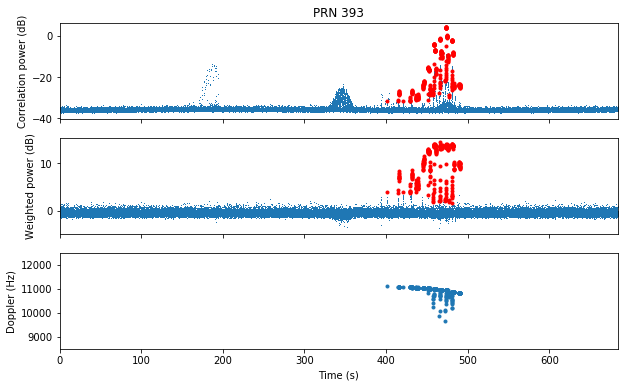
With these conditions in mind, we show detections as red dots in the figures below. We also plot the frequency for the detections.
We see that PRNs 392 and 393 (which correspond to the same Sprite) transmit between seconds 400 and 500 of the recording. The transmissions are very strong, and the Doppler curve can be seen in the frequency of the detections. Interestingly, PRN 393 has some detections at lower frequency. These may be false detections or correspond to transmissions much shorter than a symbol (for which it is difficult to estimate the frequency).
PRN 504 appears between seconds 100 and 300. It seems that the transmissions correspond to single symbols (as shown above) rather than complete packets, since we don’t have the companion PRN 505.

PRN 26 only has a few detections around the time when Sprite 392-393 was transmitting. They all indicate nearly the same frequency. This suggests that the detections correspond to complete symbols.

Finally, PRN 231 has a lot of short transmissions near the middle of the recording. The frequency resolution is very poor, since it is difficult to estimate the frequency of such short transmissions. It seems that PRN 231 transmitted a long burst of short transmissions spaced 50ms, as shown in the figure validating its detection.
An interesting remark is that different Sprites appear in different moments of the recording. Since the Dwingeloo radiotelescope has a narrow beam and was doing a planar scan, each Sprite is only spotted when it is passing through the beam. This means that there were up to 5 minutes of time difference between some of the Sprites, suggesting that the drag is very variable and it is quite difficult to predict their orbit. In the 3 days since they were launched, the Sprites swarm had spread 2000km in the along-track direction.
The figure below shows one of the data transmissions of Sprite 392-393. We see how it alternates between its two PRNs to transmit the different symbols.
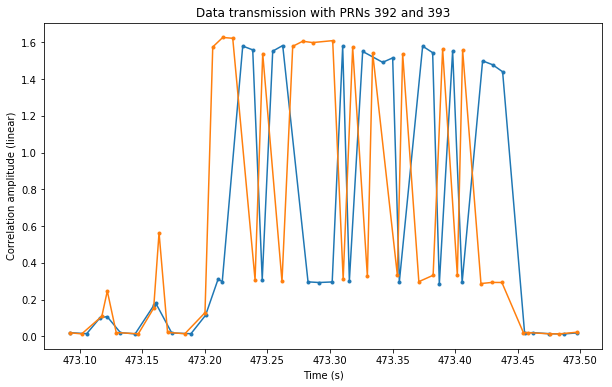
The transmissions are 30 bits long according to the decoder. The first 7 bits are a preamble (1110010), the last 7 bits are a postamble (1011000), and the remaining 16 bits encode the data. This is done by using one out of 256 possible sequences of 16 bits. Therefore, each data transmission contains only 8 bits worth of data, representing an ASCII character. In the example above, we have the sequence 0111110101001000 (note that there are some symbols missing, since it is possible that two symbols fall in the same correlation window). This corresponds to the byte 0x48, which is ASCII for ‘H’.
In conclusion, this study has been able to detect the transmissions from 4 different Sprites. Only one of them was functioning normally, transmitting complete messages. The remaining Sprites showed transmissions shorter than a complete message. Since more than 100 Sprites were launched by KickSat-2, this seems to indicate a high failure rate
The calculations and plots for this post have been done in this Jupyter notebook.
Thanks you for the interesting stuff on this blog. It’s nice to learn something about coding / decoding. I am just a repair guy (avionics, radar) and love ham radio, SDR, science…
A begun to read your blog two weeks ago right from the beginning.
Stay save! 73, Norbert – DL8LAQ