Writing GUPPI files with GNU Radio and using SETI tools

GUPPI stands for Green Bank Ultimate Pulsar Processing Instrument. The GUPPI raw file format, which was originally used by this instrument for pulsar observations, is now used in many telescopes for radio astronomy and SETI. For instance Breakthrough Listen uses the GUPPI format as part of the processing pipeline, as described in this paper. The Breakthrough Listen blimpy tools work with GUPPI files or with filterbank files (basically, waterfalls) that have been produced from a GUPPI file using rawspec.

I think that GNU Radio can be a very useful tool for SETI and radio astronomy, as evidenced by the partnership of GNU Radio and SETI Institute. However, the set of tools used in the GNU Radio ecosystem (and by the wider SDR community) and the tools used traditionally by the SETI community are quite different, and even the file formats and some key concepts are unalike. Therefore, interfacing these tools is not trivial.

During this summer I have been teaching some GNU Radio lessons to the BSRC REU students. As part of these sessions, I made gr-guppi, a GNU Radio out-of-tree module that can write GUPPI files. I thought this could be potentially useful to the students, and it might be a first step in increasing the compatibility between GNU Radio and the SETI tools. (The materials for the sessions of this year are in this repository, and the materials for 2021 are here; these may be useful to someone even without the context of the workshop-like sessions for which they were created).

In this post I will show how gr-guppi works and what are the key concepts for GUPPI files, as these files store the output of a polyphase filterbank, which many people from the GNU Radio community might not be very familiar with. The goal of the post is to generate a simulated technosignature in GNU Radio (a CW carrier drifting in frequency) and then detect it using turboSETI, which is a tool for detecting narrowband signals with a Doppler drift.

Before going on, it is convenient to mention that an alternative to this approach is using gr-turboseti, which wraps up turboSETI as a GNU Radio block. This was Yiwei Chai‘s REU project at the ATA in 2021.
Imaging Cygnus A at 8.45 GHz with ATA

Earlier this year, I published a post showing our results of the interferometric imaging of Cassiopeia A and Cygnus A at 4.9 GHz with the Allen Telescope Array. Near the end of July, I decided to perform more interferometric observations of Cygnus A at a higher frequency, in order to obtain better resolution. I chose a frequency of 8.45 GHz because it is usually a band clean of interference (since it is allocated to deep space communications), it is used by other radio observatories, so flux densities can be compared directly with previous results, and because going higher up in frequency the sensitivity of the old feeds at ATA starts to decrease.

This post is a summary of the observations and results. The code and data is included at the end of the post.

More 10 GHz sun observations

Back in 2019, I took advantage of the autumn sun outage season of Es’hail 2 to make some observations as the sun passed in front of the fixed 1.2 metre offset dish I have to receive the QO-100 transponders. Using the data from those observations, I estimated the gain of the dish and the system noise. A few weeks ago, I have repeated this kind of measurements in the spring sun outage season this year. This post is a summary of the results.

Interferometric imaging with Allen Telescope Array

In the weekend experiments that we are doing with the GNU Radio community at Allen Telescope Array we usually have access to some three antennas from the array, since the rest are usually busy doing science (perhaps hunting FRBs). This is more than enough for most of the experiments we do. In fact, we only have two N32x USRPs, so typically we can only use two antennas simultaneously.

However, for doing interferometry, and specially for imaging, the more antennas the better, since the number of baselines scales with the square of the number of antennas. To allow us to do some interferometric imaging experiments that are not possible with the few antennas we normally use, we arranged with the telescope staff to have a day where we could access a larger number of antennas.

After preparing the observations and our software so that everything would run as smoothly as possible, on 2021-02-21 we had a 18 hour slot where we had access to 12 antennas. The sources we observed where Cassiopeia A and Cygnus A, as well as several compact calibrators. After some calibration and imaging work in CASA, we have produced good images of these two sources.

Many thanks to all the telescope staff, specially to Wael Farah, for their help in planning together with us this experiment and getting everything ready. Also thanks to the GNU Radio team at ATA, specially Paul Boven, with whom I’ve worked side by side for this project.

This post is a long report of the experiment set up, the software stack, and the results. All the data and software is linked below.

Chang’e 5 interferometric astrometry

Bill Gray, from Project Pluto is doing a great job trying to estimate the orbit of Chang’e 5 as it travels to somewhere around the Sun-Earth L1 Lagrange point (see my previous post). He is using RF pointing data from Amateur observers and the Allen Telescope Array, since the low elongation and the distance of the spacecraft have made it impossible to observe it optically.

For this task, the pointing data I am obtaining with my observations on Allen Telescope Array as part of the activities of the GNU Radio community there is quite valuable, since the 6.1 metre dishes give more accurate pointing measurements than the smaller dishes of Amateurs. The pointing data from ATA should be accurate to within 0.1 or 0.2 degrees.

To try to get more accurate data for Bill, last weekend I decided to do a recording with two dishes from the array, with the goal of using interferometry to obtain a much more precise pointing solution that what can be achieved with a single dish. This post is a report of the processing of the interferometric data.

Polarimetric observation of 3C286 with Allen Telescope Array

Following my polarimetry experiments at Allen Telescope Array, on October 31 I did a polarimetric observation of the quasar 3C286 with two dishes from the array to use as a test-bed for polarimetric calibration. 3C286 is a bright, compact, polarized source, with a fractional polarization intensity of around 10% and a polarization angle of 33º over a wide range of frequencies, so it makes an ideal source for polarization calibration. It is the primary polarization calibrator for VLA. The observation duration was slightly more than 2 hours, and it was done around the transit of the source, so the parallactic angle coverage is large (around 90º).

My initial idea was to use this observation to perform a “single dish” polarization calibration of each of the dishes by separate (since the math is somewhat simpler) and then perform an interferometric polarization calibration. However, after initial examination of the data, the SNR doesn’t seem large enough to do a “single dish” calibration. The polarized signal from 3C286 is rather weak and is swamped by noise from other sources in the field and from the receiver, and also by gain variations in the receive chain.

On the contrary, the interferometric calibration has worked well, since correlating the signals from the antennas allows us to discard the uncorrelated receiver noise and to phase on the target and discard other signals from the field, by means of Earth rotation aperture synthesis.

In this post I give my analysis and results of the observation. I have done an ad hoc calibration in Python to determine the polarization leakage and measure the polarization degree and angle of the source, and also a full polarimetric calibration in CASA to compare my calibration with one obtained with professional software.

The data used in this post has been published in Zenodo as the dataset “Allen Telescope Array polarimetric observation of 3C286“.

Sun observations at 10GHz

Around October 9 it was the sun outage season for Es’hail 2 as seen from Madrid. This means that the sun passed behind Es’hail 2, so it was the perfect occasion to observe the sun with my QO-100 groundstation, which has a 1.2m offset dish antenna pointing to Es’hail 2. This is an account of the measurements I made, and their use to evaluate the receiver performance.

Second Moon observation with my QO-100 station.

In May 25, the Moon passed through the beam of my QO-100 groundstation and I took the opportunity to measure the Moon noise and receive the Moonbounce 10GHz beacon DL0SHF. A few days ago, in July 22, the Moon passed again through the beam of the dish. This is interesting because, in contrast to the opportunity in May, where the Moon only got within 0.5º of the dish pointing, in July 22 the Moon passed almost through the nominal dish pointing. Also, incidentally this occasion has almost coincided with the 50th anniversary of the arrival to the Moon of Apollo 11, and all the activities organized worldwide to celebrate this event.

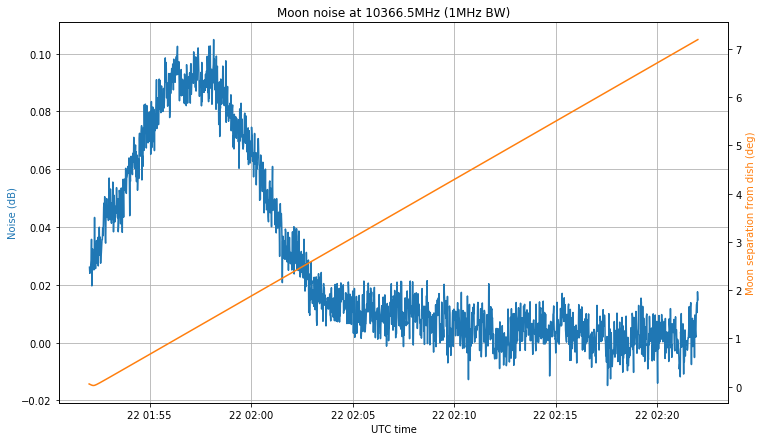
The figure below shows the noise measurement at 10366.5GHz with 1MHz and a 1.2m offset dish, compared with the angular separation between the Moon and the nominal pointing of the dish (defined as the direction from my station to Es’hail 2). The same recording settings as in the first observation were used here.

The first thing to note is that I made a mistake when programming the recording. I intended to make a 30 minute recording centred at the moment of closest approach, but instead I programmed the recording to start at the moment of closest approach. The LimeSDR used to make the recording was started to stream one hour before the recording, in order to achieve a stable temperature (this was one lesson I learned from my first observation).

The second comment is that the maximum noise doesn’t coincide with the moment when the Moon is closest to the nominal pointing. Luckily, this makes all the noise hump fit into the recording interval, but it means that my dish pointing is off. Indeed, the maximum happens when the Moon is 1.5º away from the nominal pointing, so my dish pointing error is at least 1.5º. I will try adjust the dish soon by peaking on the QO-100 beacon signal.

The noise hump is approximately 0.085dB, which is much better than the 0.05dB hump that I obtained in the first observation. It may not seem like much, but assuming the same noise in both observations, this is a difference of 2.32dB in the signal. This difference can be explained by the dish pointing error.

The recording I have made also covers the 10GHz Amateur EME band, but I have not been able to detect the signal of the DL0SHF beacon. Perhaps it was not transmitting when the recording was made. I have also arrived to the conclusion that the recording for my first observation had severe sample loss, as it was made on a mechanical hard drive. This explains the odd timing I detected in the DL0SHF signal.

The next observation is planned for October 11, but before this there is the Sun outage season between September 6 and 11, in which the Sun passes through the beam of the dish, so that Sun noise measurements can be performed.

First Moon observation with my QO-100 station

A month ago, I spoke about planning the passes of the Moon through the beam of my QO-100 station. These give an occasion to observe the Moon without moving a dish that is pointing to Es’hail 2. The next opportunity after writing that post was on May 16 at 20:16 UTC.

Since I wasn’t going to be at home at that time, I programmed my computer to make a recording for later analysis. I recorded 4MHz of spectrum centred at 10367.5MHz using a LimeSDR connected to the LNB that I use to receive QO-100. The recording was planned to be 30 minutes long starting at 20:01 UTC, but for some reason only approximately 27 minutes were recorded.

This kind of events can be used to measure Moon noise and receive 10GHz EME signals. This post is an analysis of my recording, looking at these two things.