As we’ve been doing lately, last weekend we observed the Chang’e 5 orbiter at Allen Telescope Array as part of the GNU Radio community activities in the telescope. This post contains a large overview of these observations, including the efforts to determine the spacecraft orbit, the study of the signal polarization, and the data obtained by decoding the telemetry.
I am still transferring the IQ data from the telescope, but I will publish the recordings in Zenodo in a few days and update this post.
Edit 2021-01-02: the recordings are now published and can be found in the following datasets.
- Chang’e 5 RF recording at 8471.2 MHz with Allen Telescope Array on 2020-12-19 (X polarization)
- Chang’e 5 RF recording at 8471.2 MHz with Allen Telescope Array on 2020-12-19 (Y polarization)
- Chang’e 5 RF recording at 8486.2 MHz with Allen Telescope Array on 2020-12-19 (X polarization)
- Chang’e 5 RF recording at 8486.2 MHz with Allen Telescope Array on 2020-12-19 (Y polarization)
- Chang’e 5 RF recording at 8471.2 MHz with Allen Telescope Array on 2020-12-20
- Chang’e 5 RF recording at 8486.2 MHz with Allen Telescope Array on 2020-12-20
Orbit
On December 16, the orbiter did an Earth fly by, avoiding reentry and dropping the capsule containing the lunar samples. The fate of the orbiter was unknown at that time, but there were words that it had plenty of spare fuel and an extended mission was being planned.
Amateur observers such as Edgar Kaiser DF2MZ and Scott Tilley VE7TIL were able to detect the orbiter’s telemetry signals on December 17, confirming that the spacecraft was still in space. However, its new orbit wasn’t know. Scott, Mike Loucks and Bill Gray set to try to determine the orbit.
The initial data suggested an elliptical orbit with apogee at the Moon’s orbit, so that in three revolutions a Moon flyby could be performed to send the orbiter somewhere else. Observations with the ATA are of large help for this, because the 6.1 metre dishes have a rather narrow beamwidth at 8.4 GHz, so dish pointing data from ATA tends to be accurate to within 0.2 degrees, which is much better than what can be achieved with the smaller dishes of Amateur stations.
On the other hand, the narrow beamwidth of ATA makes it more difficult to find the signal, since even a small error in pointing will make it disappear completely in the noise. On Saturday 19 I used the pointing data from Edgar as a starting point for my search and managed to locate the spacecraft after some 45 minutes of manual search.
On Sunday 20 I wasn’t so lucky. I used the orbit that Bill had estimated as my initial search location, and after searching for a while manually, I decided to automate the search by slowly sweeping a small area of the sky to produce a signal intensity map. I started at the point predicted by Bill’s orbit and continued outwards, sweeping an ever increasing circular patch of the sky.
The resulting map can be seen below. Each of the squares in the image corresponds to 0.2 x 0.2 degrees and takes several seconds to generate, including 3 seconds of integration and the time that it takes to command and move the dish. In fact, this image took one hour and 15 minutes to generate.
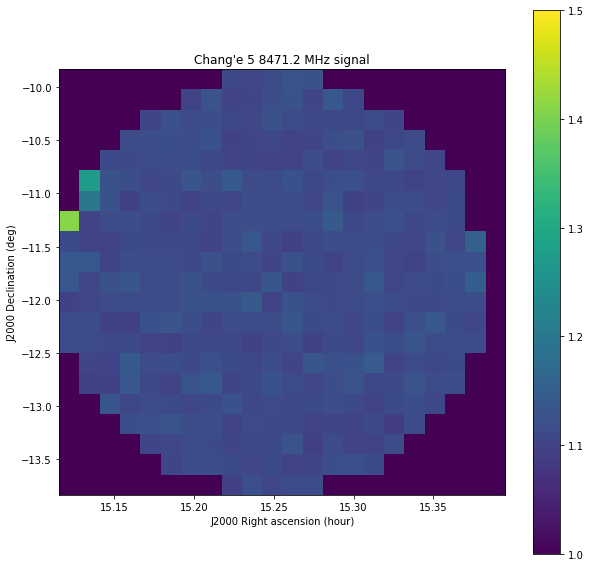
We can already see the signal leaking in at the upper left border of the scanned circle, so at that point I decided to stop this search and start a new one centred at that point with the objective of fine tuning the signal location.
The resulting image is below. Here we clearly locate the spacecraft’s signal to one particular point of the sky. Note the change in the colour map range between this image and the previous one.
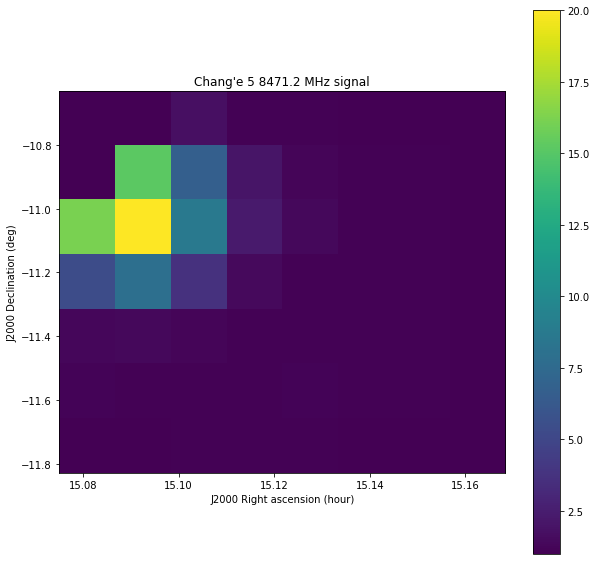
As it turns out, the real position of the spacecraft was more than one degree away from my initial search location (which was taken from Bill’s orbit). The reason for this is that our initial ideas for the orbit were wrong. After including this new pointing data in his orbit solution, Bill noticed that the orbit’s apogee was much larger than we thought. In fact, the spacecraft was already on a direct path to the Sun-Earth L1 Lagrange point. An official statement of this fact appeared in the news more or less at the same time we realized this.
Still, our orbit estimate is far from perfect and has to be refined using further pointing and Doppler data. One of the main questions is whether the elongation and inclination is correct for a direct route to L1 or whether it will just go nearby L1.
The figure below shows a simulation in GMAT using some preliminary orbit data. We see that the spacecraft lags 45 degrees behind the L1 point until April 2021, when it starts being ejected slowly. It may happen that this is already good enough to wait until the appropriate moment to hop to a near-Earth asteroid, which seems the most likely science target, or that small corrections can keep the spacecraft hovering around L1 for longer or nudge it closer to it.
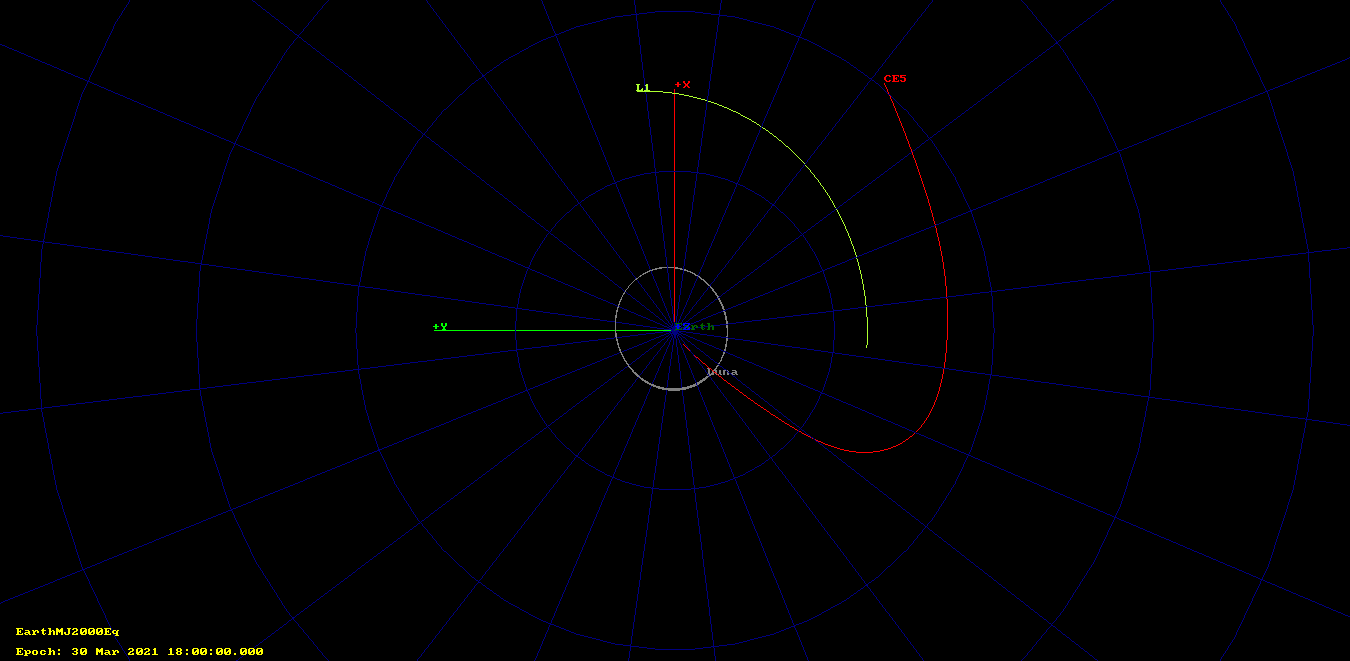
The orbit data used in the image above was taken from Bill’s pseudo-MPEC from Dec 20 21:46:31 UT, which gives the following state vector in GMAT.
GMAT CE5.Epoch = '17 Dec 2020 00:00:00.000';
GMAT CE5.CoordinateSystem = EarthMJ2000Eq;
GMAT CE5.DisplayStateType = Keplerian;
GMAT CE5.SMA = 900894.1644560199;
GMAT CE5.ECC = 0.9907153885000005;
GMAT CE5.INC = 41.77831500000001;
GMAT CE5.RAAN = 34.46469513000001;
GMAT CE5.AOP = 27.48516173000009;
GMAT CE5.TA = 148.0487466775136;
Polarization and signal strength
Both on Saturday 19 and Sunday 20 the spacecraft signals were recorded during the full pass, until the spacecraft was lost below the 16.8 degree minimum elevation for tracking. On the 20th a lot of time was lost searching for the signal, so the recording starts some two hours late.
As usual, the signal at 8471.2 MHz was strong. The second orbiter signal at 8486.2 MHz was also present, but it was much weaker, so telemetry could only be decoded from 8471.2 MHz. However, an initial study of the Doppler from these two signals shows that the 8486.2 MHz signal drifts much less. This is probably caused by the two transmitters being in different locations, with the 8486.2 MHz transmitter at a more thermally stable position, perhaps shaded from the Sun. Thus, even if weaker, the 8486.2 MHz signal can give us more accurate Doppler data.
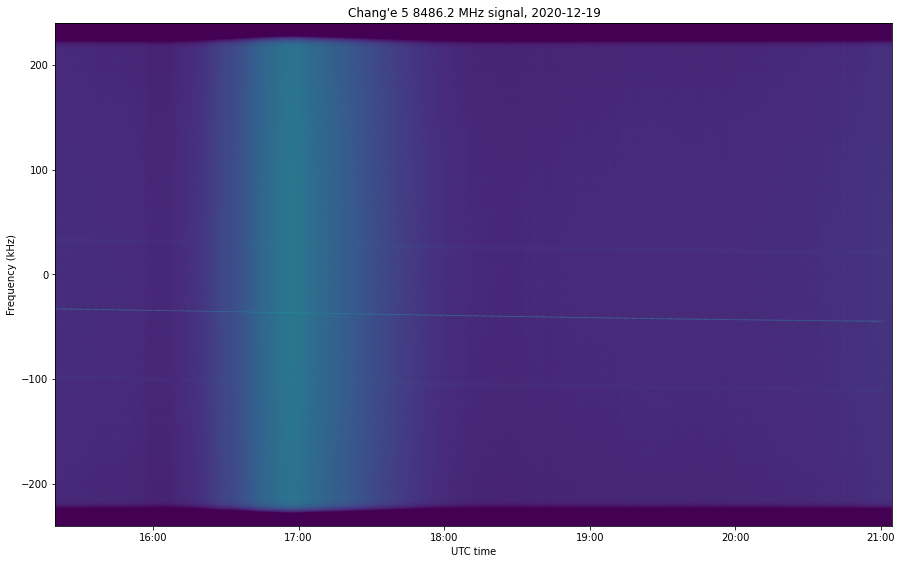
The figures below show the waterfall for the 8471.2 MHz and 8486.2 MHz signals for December 19. We can see a large increase in the noise floor around 17:00 UTC. I’m not sure of the cause of this, but I suspect ground noise entering through some of the dish sidelobes. We see that the signal is not in ground lock, since the idle telecommand signal being looped back at +/- 8 kHz from the main carrier is missing. The data sidebands are clearly visible in the 8471.2 MHz signal and almost in the noise in the 8486.2 MHz.
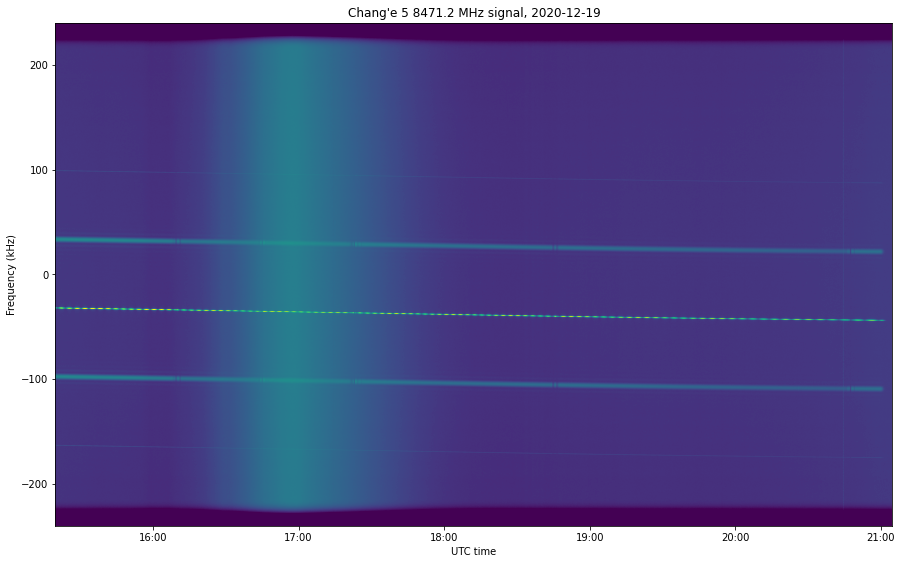
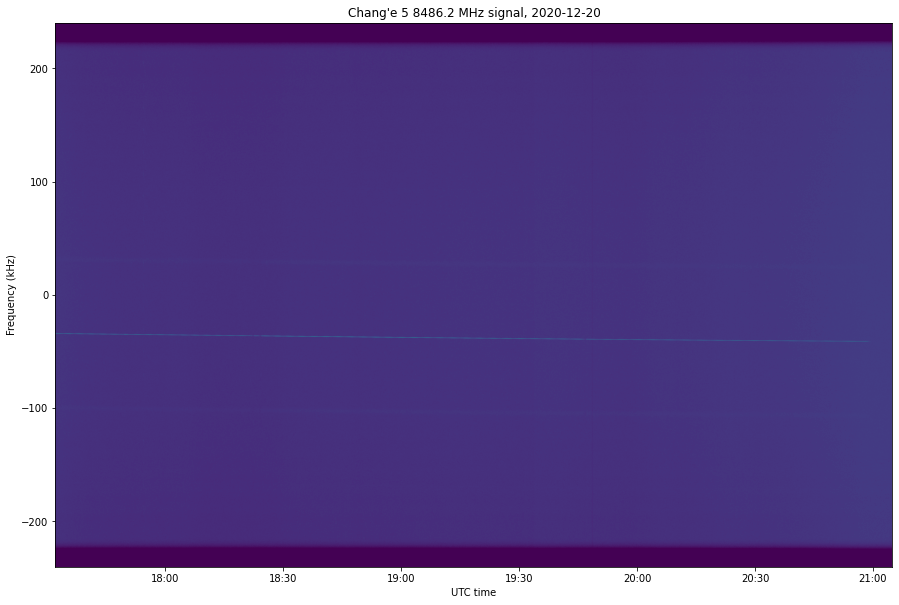
The waterfalls for December 20 are very similar. There is no noise hump, but the recording starts after 17:00 UTC. The sky track was quite similar on both days, so if the noise increase happens at a particular azimuth and elevation, then we would have missed it because of the late start on the 20th.

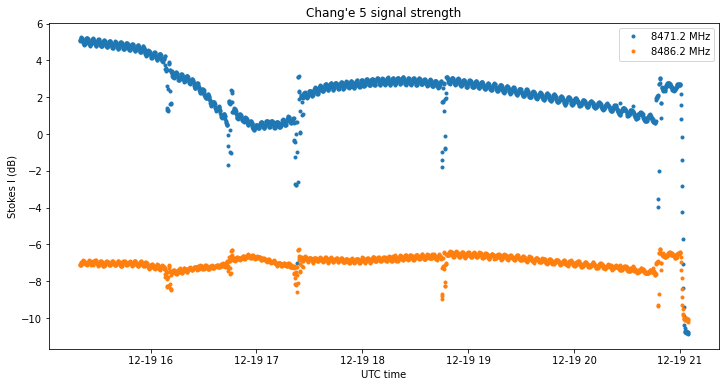
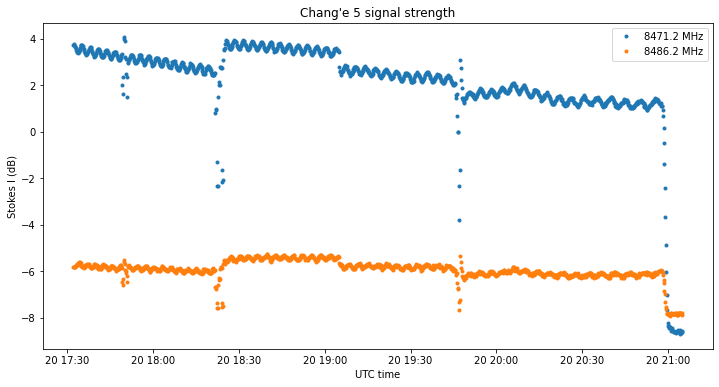
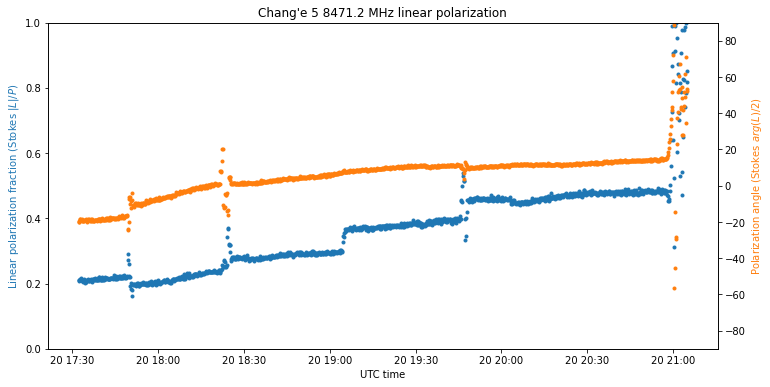
The signal strength (Stokes \(I\)) is shown in the plots below. The wiggles are an artefact caused by how the measurement is made (scalloping loss in the FFT). The measurement is signal plus noise of the main carrier, rather than just signal, so the measurement of the weak carrier 8486.2 MHz is not accurate.
The small jumps in the traces correspond to the moments when I tried to move the pointing slightly to improve the signal. Any variations seen here should not be taken too seriously, since they can be caused by a the pointing not being very good, rather than a real change in signal strength.
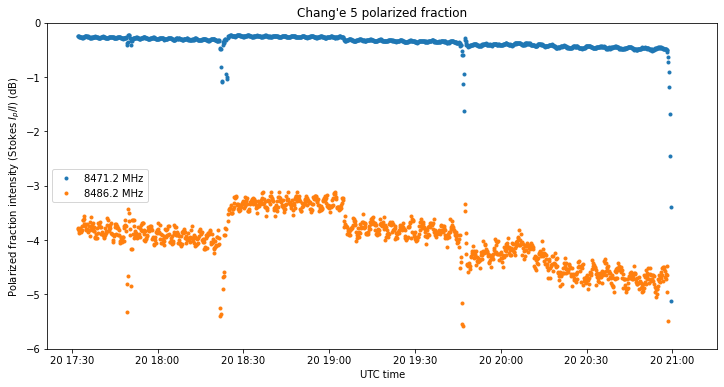
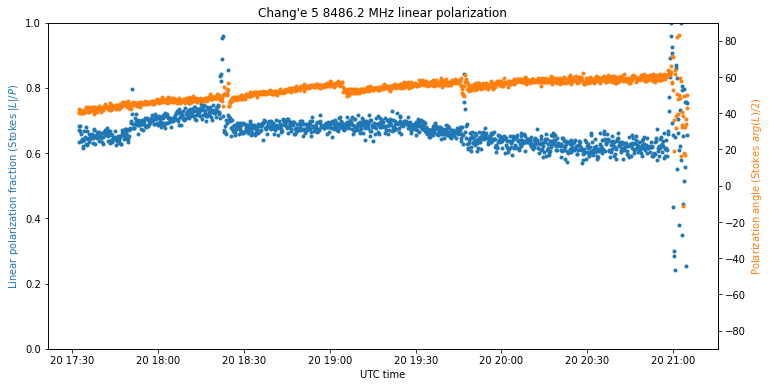
The polarized fraction (Stokes \(P/I = \sqrt{Q^2 + U^2 + V^2}/I\)) shows the degradation caused when unpolarized noise is included in the measurement for the weaker SNRs. For the weak 8486.2 MHz carrier we see that, in the measurement bandwidth, 50% or more of the power is unpolarized noise. Therefore, to normalize the Stokes \(L = Q + iU\) and \(V\) I have decided to divide by \(P\) rather than \(I\) as I was doing in previous polarization studies of Chang’e 5.

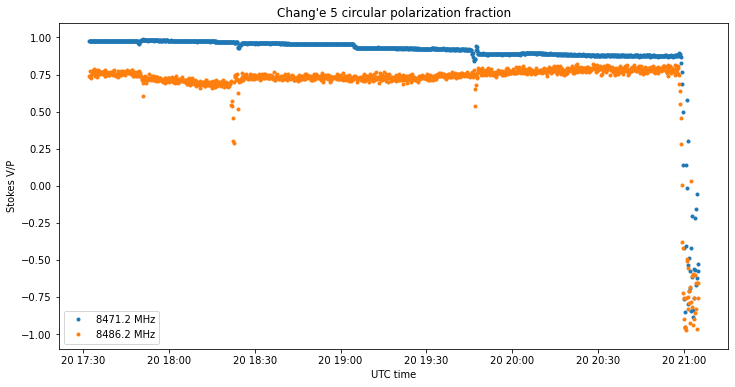
The plots below show Stokes \(V/P\), which indicates the circular polarization fraction and handedness. As in the previous weekend we see that the signal at 8471.2 MHz has almost ideal RHCP. This makes sense, because this should be the antenna that is pointing directly to Earth. The signal from 8486.2 MHz is seen with elliptic polarization, since it is probably pointing in a different direction.
On the 20th we see a decrease in the Stokes \(V\) of the 8471.2 MHz signal. This, together with the decrease in signal strength may be caused by a dish pointing error, but it could indicate that the spacecraft’s antenna is slowly moving away from Earth. In fact, since the Chinese are probably not going to monitor the spacecraft so often during the long trip to L1 (as evidenced by the lack of a ground lock seen in these observations), it is not so important that one of the antennas is kept pointing to Earth.

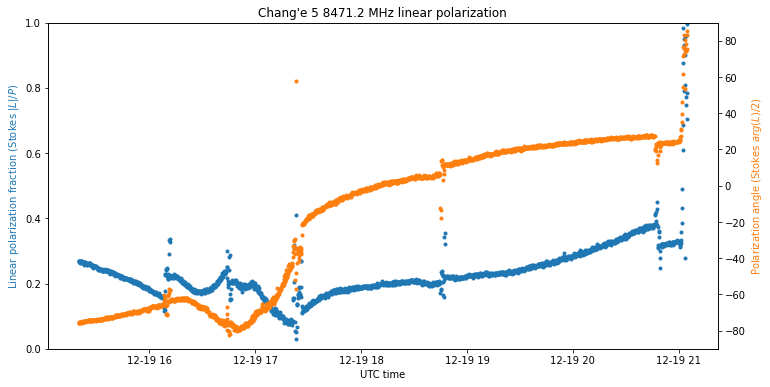
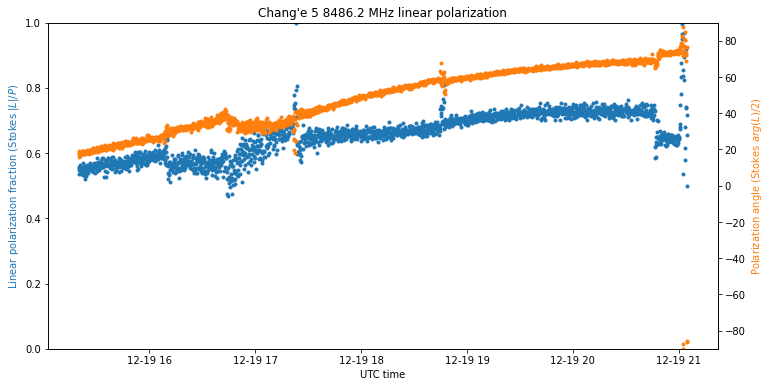
The two figures below show the relative strength and angle of the linear polarization on December 19th. Something weird happens with the polarization angle of the 8471.2 MHz signal around 17:00 UTC, but otherwise both signals show a slow increase in the angle throughout the observation. Note that this data is not corrected for parallactic angle rotation.
On December 20th we see a similar slow increase in the polarization angle throughout the observation. We also see a noticeable increase in the fractional linear polarization of the 8471.2 MHz signal, which matches the decrease in Stokes \(V\) we saw above.
The Jupyter notebooks used to produce these plots can be found here and here.
Telemetry
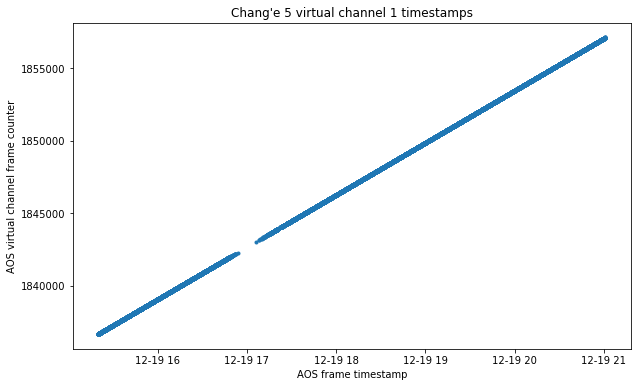
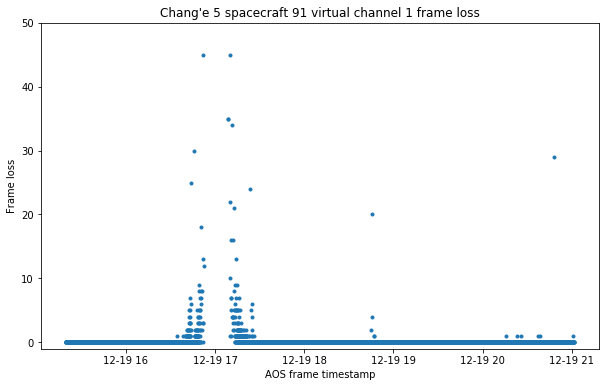
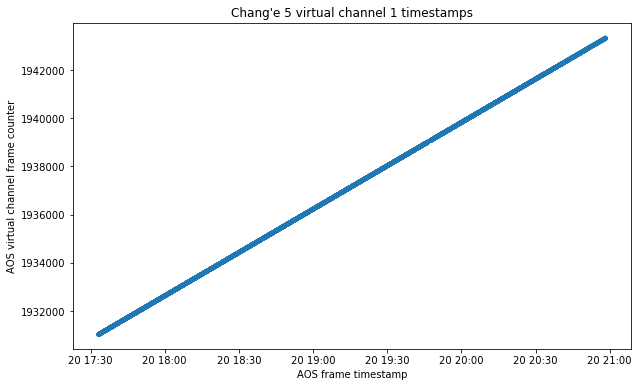
The telemetry decoded from the 8471.2 MHz signal contains, as usual, CCSDS AOS frames using virtual channel 1 for real time telemetry. I have analysed it in a Jupyter notebook for 2020-12-19 and another one for 2020-12-20.
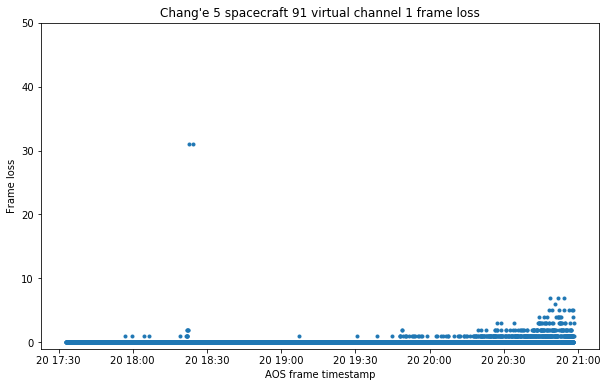
The decoded frames and frame loss for Saturday 19 are shown below. The decoding is quite good, except for a short interval around 17:00 UTC when the noise level rose higher and the signal became a bit weaker.
The frames decoded on Sunday 20 do not have any gaps, but during the last hour of the observation we have some frame loss, since the signal was a bit weaker.
In the real time telemetry, only APIDs between 2 and 60, and between 1029 and 1040 are active. Compared with the observations done the previous weekend, as the spacecraft was exiting the lunar orbit and returning to Earth with the samples’ capsule, the APIDs between 257 and 296 are now missing. I think there can be at least two reasons for this. First, these APIDs may correspond to subsystems which have been shut down, as they are not needed for the trip to L1. Another explanation is that these APIDs are only active when the spacecraft is in ground lock, which was the case during the previous weekend but not on December 19 and 20.
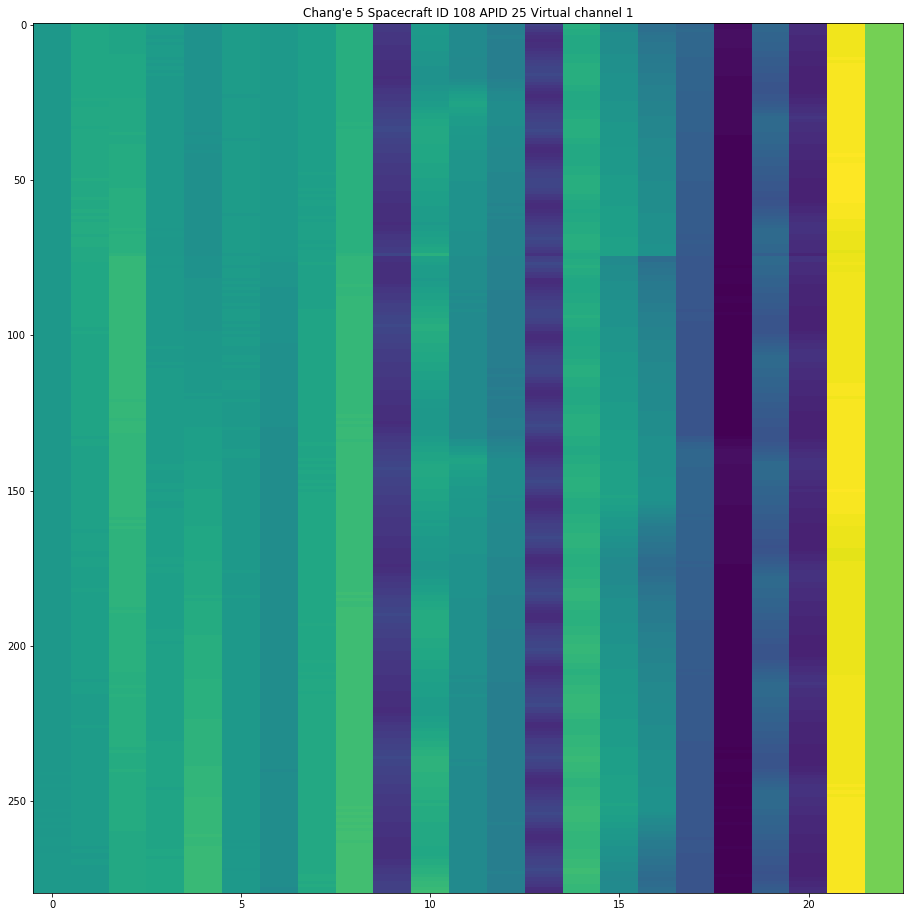
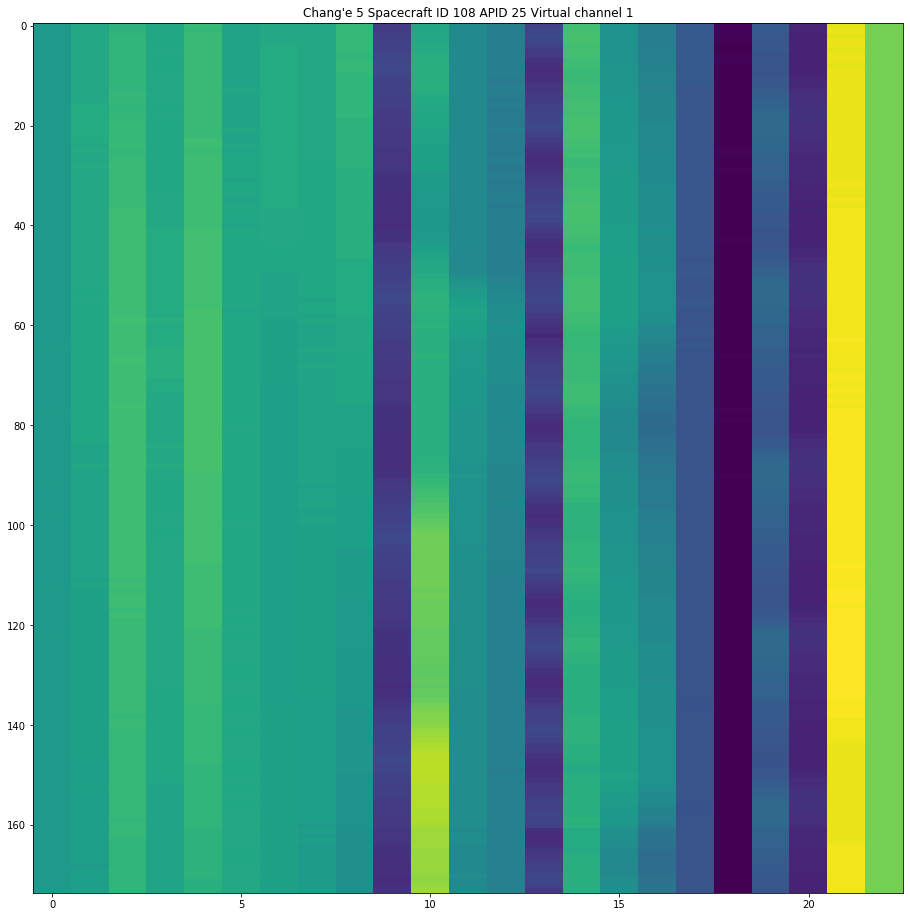
The content of each of the APIDs is very similar between December 19 and 20. Many show static values, and there are some other oscillating telemetry channels that maybe have something to do with thermal regulation. As and example, below we show APID 25 for the 19th (left) and 20th (right). This channel is interesting because byte 10 has a different behaviour near the end of the observation on the 20th. The full plots of all the APIDs can be found in the Jupyter notebooks.
3 comments