Last weekend, we did two long observations of Chang’e 5 with one of the dishes from Allen Telescope Array as part of the activities of the GNU Radio community in the telescope. The recordings were done during the UTC evenings on Saturday 2020-12-12 and Sunday 2020-12-13, and almost lasted for all the time that the spacecraft was above 16.8 degrees, which is the elevation mask for the telescope. Since the Moon was at a low declination, the observations were not so long, only around 4 to 5 hours.
On Saturday, the spacecraft had already performed its TEI-1 (trans-Earth injection burn) and was on an elliptical lunar orbit. On Sunday, the spacecraft had performed TEI-2 and was already on its transfer orbit to Earth, and several degrees away from the Moon, as shown by the blue cross in the figure below, done with Stellarium.

The IQ recordings of the observations will be published in Zenodo in a few days, since I need to transfer them over the slow internet connection of the telescope. This post will be updated when they are ready.
Update 2020-12-19: The recordings are now published in the following datasets:
- Chang’e 5 RF recording at 8471.2 MHz with Allen Telescope Array between TEI-1 and TEI-2 (X polarization)
- Chang’e 5 RF recording at 8471.2 MHz with Allen Telescope Array between TEI-1 and TEI-2 (Y polarization)
- Chang’e 5 RF recording at 8471.2 MHz with Allen Telescope Array after TEI-2 (X polarization)
- Chang’e 5 RF recording at 8471.2 MHz with Allen Telescope Array after TEI-2 (Y polarization)
In this post, I look at the telemetry decoded from these recordings. Future posts will look at other aspects, such as the polarization of the signal.
The only signal from the Chang’e 5 that was detected with ATA was the one at 8471.2 MHz. No signals were detected in any of the other three frequencies known to be used for low rate telemetry (see this post). The signal at 8471.2 MHz corresponds to the orbiter, as it became evident after the orbiter and lander+ascender separated for the lunar landing. However, the signal at 8486.2 MHz also corresponds to the orbiter, and according to my analysis of the telemetry it transmitted exactly the same data as 8471.2 MHz, to allow diversity reception. The lack of this signal during the return trajectory is interesting, since it was transmitting still on 2020-12-08, as detected by Edgar Kaiser DF2MZ.
In both observations, the 4096 baud signal at 8471.2 MHz contains CCSDS AOS frames from spacecraft ID 108 (which corresponds to the orbiter). Only virtual channel 1 was in use. This virtual channel is used to transmit real time telemetry.
The figures below shows the decoded frames and frame loss for the observation done on Saturday. There are some gaps where no frames could be decoded because the SNR was too low.
This was mainly caused because I was hand tracking due to the lack of accurate ephemeris. My tracking strategy was to point to a constant right ascension and declination. Every 10 or 20 minutes, I checked if the signal had become weaker and then I moved the telescope slightly to try improve the signal. With a 6.1m dish, the beamwidth is narrow enough (0.4 degree 3dB beamwidth) to make this a difficult task, since the Moon also moves in right ascension throughout the observation.
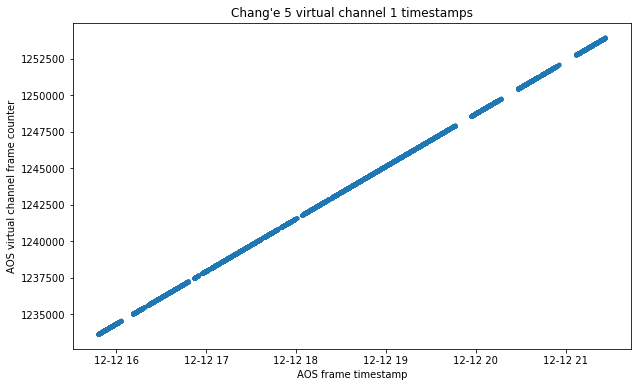
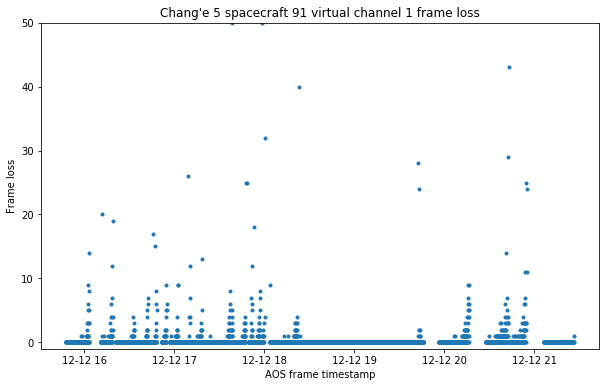
Nevertheless, a total of 15513 frames could be decoded. At one second per frame this corresponds to 4 hours and 18 minutes of data.
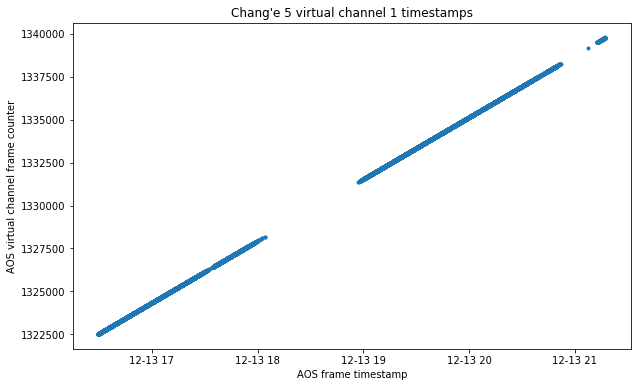
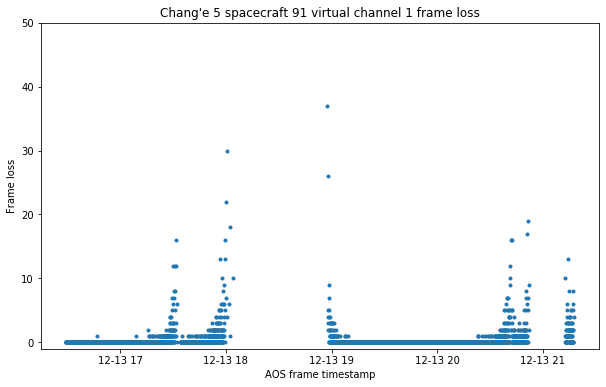
The figures below show the frames decoded and lost during the observation on Sunday. The same problem with gaps of weak SNR happens, but here we have some large gaps. In this case tracking was easier, since the spacecraft was already out of the lunar orbit, so its movement was easier to predict. A total of 11133 frames (3 hours and 5 minutes) could be decoded.
The AOS frames carry CCSDS Space Packets. The APIDs of these range between 2 and 60, between 257 and 296, and between 1029 and 1040. As I detected in my analysis of the lander telemetry, the APID range 512-1023 corresponds to lander subsystems, while the ranges 0-511 and 1024-1279 correspond to the orbiter. While all the spacecraft were still joined together, all the telemetry signals included APIDs from all the ranges, but after the lander and orbiter separated, each spacecraft transmitted only their own APID ranges.
Most of the data in the APIDs is static, and fields that change seem of a thermal nature (there are often exponential growths and decays when their values are plotted versus time). The behaviour of each APID is similar to that seen on 2020-11-28, before the spacecraft arrived into lunar orbit.
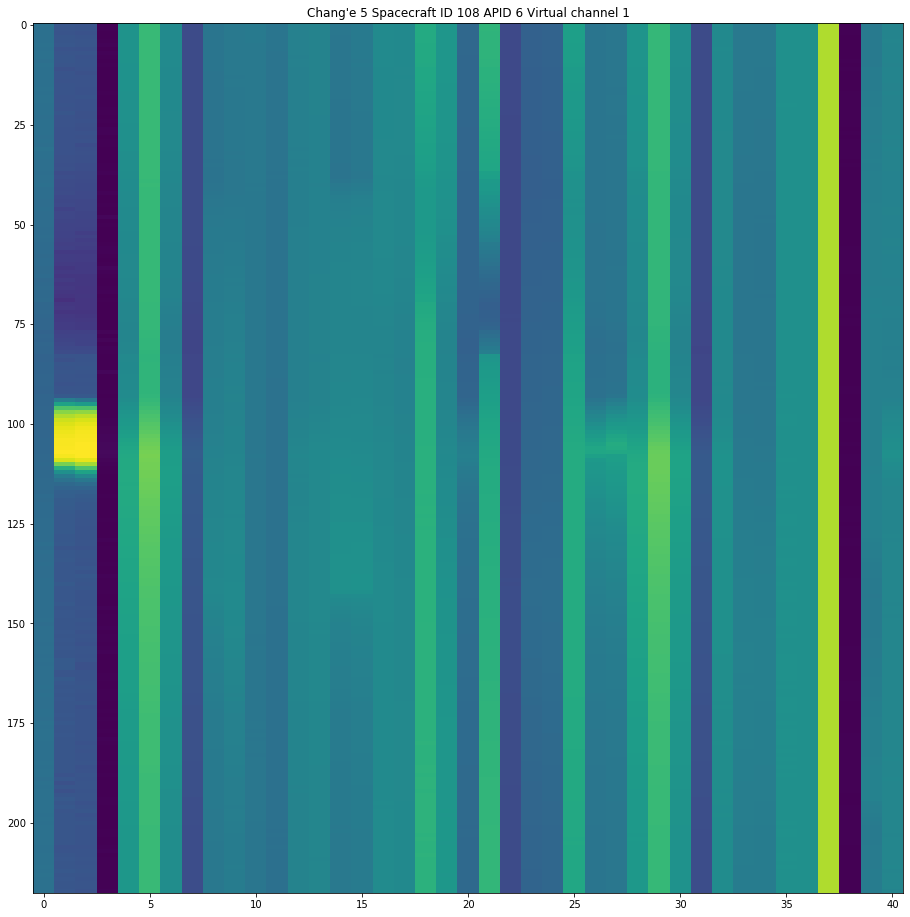
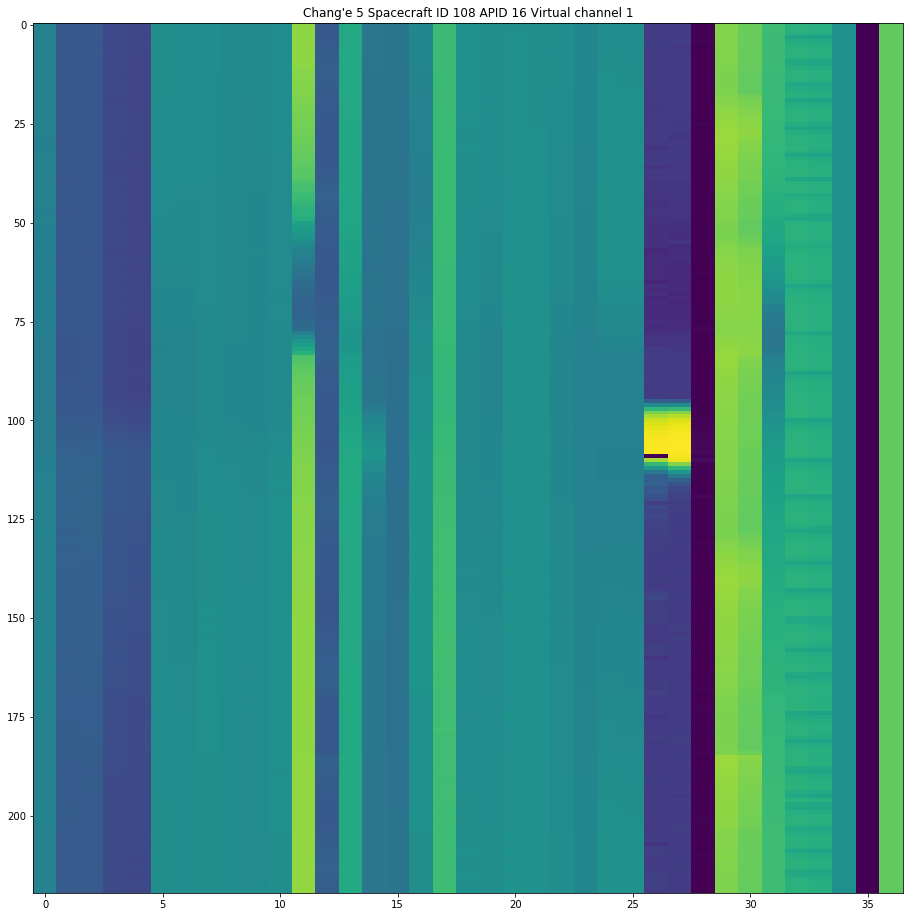
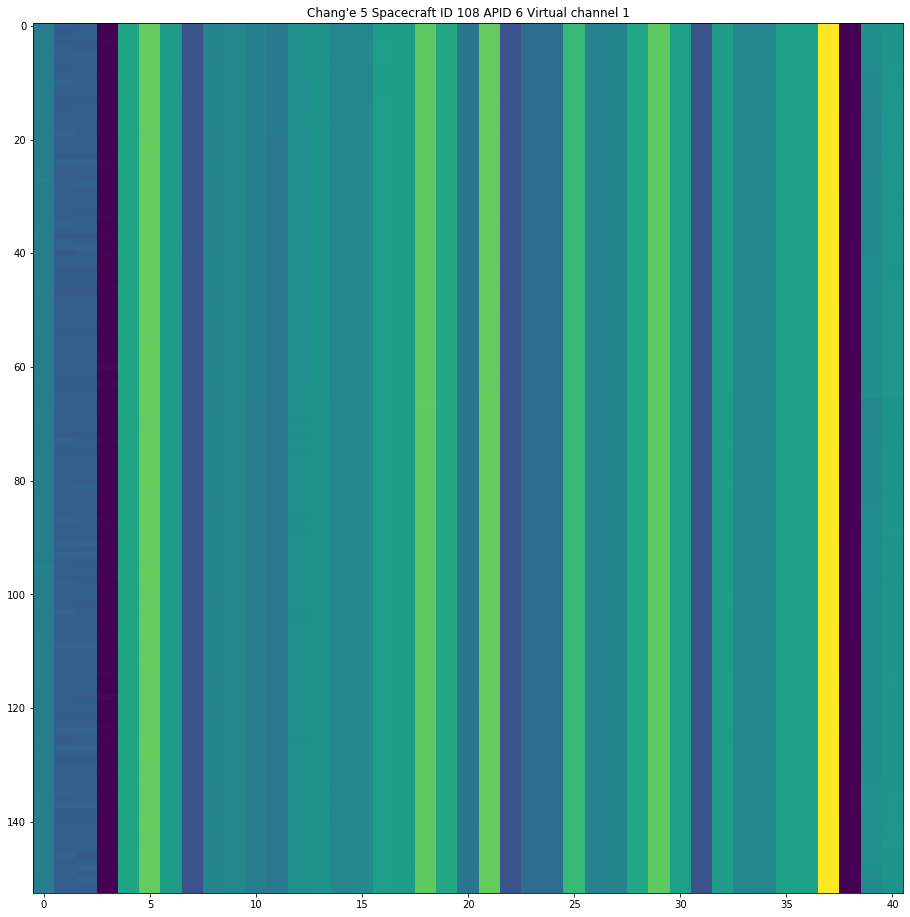
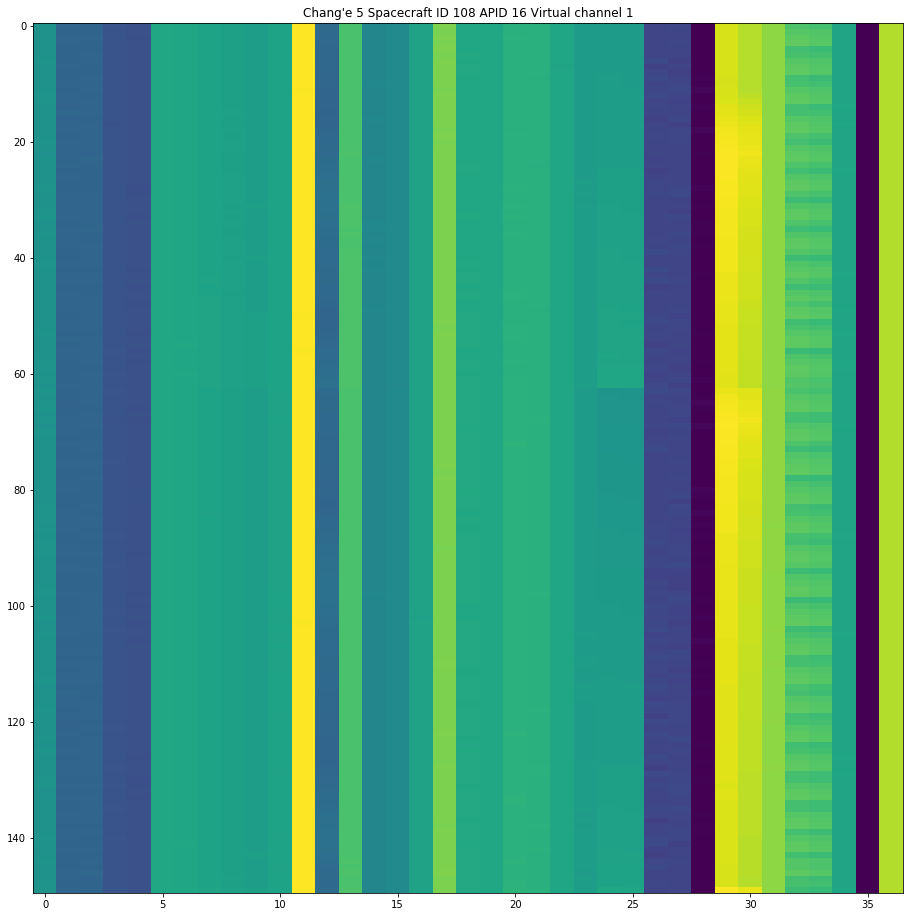
The plots below show an interesting event that happened on Saturday (left column) in APIDs 6 and 16. The same APIDs from Sunday (right column) are provided for comparison. I have no clue what these fields describe. The full plots of all the APIDs can be found in the Jupyter notebooks for Saturday and for Sunday.
The files with the decoded frames are provided in the Github repository. The decoder used with these recordings was an adaptation of the decoder shown here, modified for 480ksps instead of 240ksps, since the sample rate for the recordings was increased in order to accommodate more easily the Doppler shifts.
3 comments