Back in 2019, I took advantage of the autumn sun outage season of Es’hail 2 to make some observations as the sun passed in front of the fixed 1.2 metre offset dish I have to receive the QO-100 transponders. Using the data from those observations, I estimated the gain of the dish and the system noise. A few weeks ago, I have repeated this kind of measurements in the spring sun outage season this year. This post is a summary of the results.
The equipment I used was the same set up that I normally use to receive the NB transponder. This consists of a 1.2 m offset dish from diesl.es, an Avenger PLL321S-2 LNB, and a LimeSDR mini. The LNB and LimeSDR are locked to a 27 MHz reference that is locked to GPS. The LimeSDR mini is connected to a Beaglebone black ARM board and samples at 600 ksps using the software described in this post.
The noise power measurements were done at a frequency of 10488 MHz, just below the NB transponder, with 600 kHz bandwidth, and the H polarization channel of the LNB. This is relevant because in principle there might be some difference in the noise performance of each of the LNB channels. I didn’t take note of which channel I used in my measurements in 2019, but probably it was the V channel, since that’s what is used for the NB transponder. This time I wanted to measure the H channel, which is used for the WB transponder, since receiver performance is more important for this transponder.
I used this GNU Radio flowgraph to receive in my laptop the IQ samples streamed by the Beaglebone black using the linrad network protocol and compute average power at a rate of 1 Hz. The measurements are saved to a file for later analysis in a Jupyter notebook.
The figure below shows the complete time series of power measurements done over the first 9 days of March. We can see a spike each time that the Sun passes through the dish beam. The spikes get stronger towards March 4, which is when the sun passes closest to the beam centre.

There are other interesting things to note in this plot. First, the dips near mid-day, which are caused by a decrease in LNB gain with higher ambient temperature. The second, some noticeable increases in the noise in the last two days. These correspond to rain, but that could be a topic for another post.
Next we show all the Sun noise peaks of each day laid on top of each other, synchronized according to the point where the maximum noise is achieved. The noise is maximum on March 4, and on March 3 and March 5 the noise is almost equal. This means that on March 3 and March 5 the Sun passed approximately within the same distance of the beam centre. Therefore, on March 4 the Sun passed very close to the beam centre. This contrasts with the observations on October 2019, where the beam centre was almost in the middle of the Sun tracks on October 8 and 9.

The figure below shows the tracks followed by the Sun on each day. The black dot corresponds to the moment when the noise curve attains its maximum. The red cross shows the location on the sky of Es’hail 2 according to the TLEs, which is 138.84 degrees azimuth, 34.10 degrees elevation. The actual centre of the beam is closer to the black dot on the red curve.
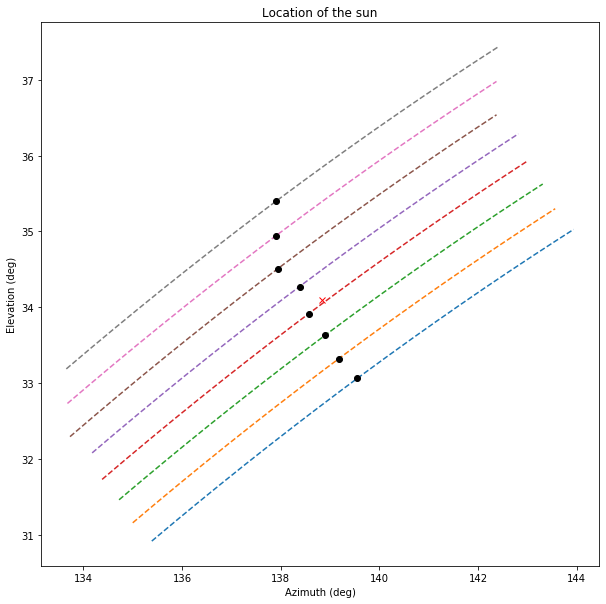
The distances between the red track and the neighbouring tracks are on the order of 0.4 degrees, while the distance between the black dot on the red track and the red cross is 0.3 degrees.
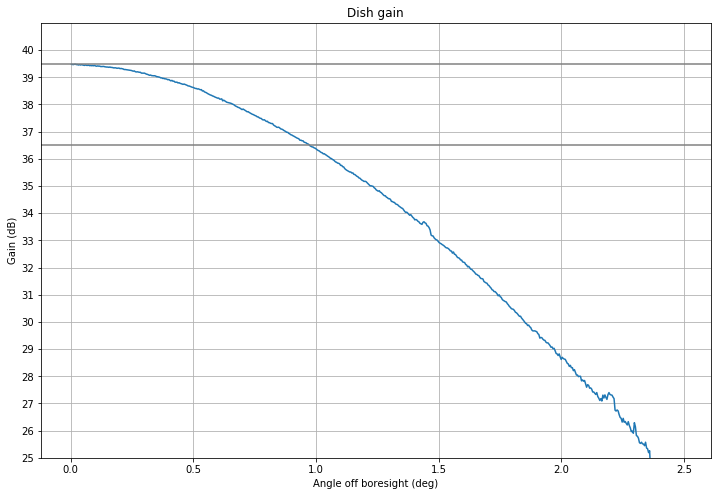
Using the Sun noise measurement on March 4 (the red track), we can estimate the dish gain as explained in this post. This technique gives us a gain of 39.5 dB and the gain pattern seen below. This contrasts with the gain of 40.5 dB that I estimated on my observations in 2019. I think that the reason is that the since the Sun didn’t pass through the centre of the beam in 2019, this technique overestimated the gain slightly. For a 1.2 metre diameter dish, this 39.5 dB gain represents an efficiency of 51%, which looks reasonable.
Once we have estimated the dish gain, we can use the solar flux and the magnitude of the Sun noise peak to estimate the cold sky system noise (which is the sum of several things, including receiver noise, spillover, atmospheric noise, and the cosmic microwave background). This solar flux calculator gives a 303.3 SFU flux at 10488 MHz by interpolating the measurements done by Learmonth at other frequencies.
Working as in my 2019 post, from this flux we estimate an increase in 555 K in the noise temperature when the Sun is in the beam centre. From the (S+N)/N of the Sun noise maximum, we get a cold sky system noise of 248 K. This is much less than the value of 327 K that I obtained in 2019, owing to the lower estimate for the dish gain.
This new estimate of 248 K system noise seems more credible. Ian Roberts ZS6BTE estimated the noise temperature of this LNB model to be 180 K. In his study, he assumed an antenna temperature of 70 K, mainly to account for dish spillover. So Ian’s measurement of the system noise is 250 K, which is very close to my estimate.
As we have seen, the estimation of the the system noise is very dependent on a accurate estimation of the dish gain. In fact, it is difficult to estimate independently or decouple these two parameters. To remedy this problem, we can use G/T, which being a quotient of gain and system noise is not so dependent on gain errors. Luckily, G/T is the parameter that matters for most receiver link budget calculations. With the gain of 39.5 dB and the system noise of 248 K that I obtained, we get a G/T of 15.56 dB. With the values of 40.5 dB and 327 K that I obtained in 2019, the G/T would be 15.35 dB.
The calculations and plots in this post have been done in this Jupyter notebook.