Earlier this year, I published a post showing our results of the interferometric imaging of Cassiopeia A and Cygnus A at 4.9 GHz with the Allen Telescope Array. Near the end of July, I decided to perform more interferometric observations of Cygnus A at a higher frequency, in order to obtain better resolution. I chose a frequency of 8.45 GHz because it is usually a band clean of interference (since it is allocated to deep space communications), it is used by other radio observatories, so flux densities can be compared directly with previous results, and because going higher up in frequency the sensitivity of the old feeds at ATA starts to decrease.
This post is a summary of the observations and results. The code and data is included at the end of the post.
A couple months ago I presented my work-in-progress design for a data modem intended to be used through the QO-100 NB transponder. The main design goal for this modem is to give the maximum data rate possible in a 2.7 kHz channel at 50 dB·Hz CN0. For the physical layer I settled on an RRC-filtered single-carrier modulation with 32APSK data symbols and an interleaved BPSK pilot sequence for synchronization. Simulation and over-the-air tests of this modulation showed good performance. The next step was designing an appropriate FEC.
Owing to the properties of the synchronization sequence, a natural size for the FEC codewords of this modem is 7595 bits (transmitted in 1519 data symbols). The modem uses a baudrate of 2570 baud, so at 50 dB·Hz CN0 the Es/N0 is 15.90 dB. In my previous post I considered using an LDPC code with a rate of 8/9 or 9/10 for FEC, taking as a reference the target Es/N0 performance of the DVB-S2 MODCODs. After some performing some simulations, it turns out that 9/10 is a bit too high with 7595 bit codewords (the DVB-S2 normal FECFRAMEs are 64800 bits long, giving a lower LDPC decoding threshold). Therefore, I’ve settled on trying to design a good rate 8/9 FEC. At this rate, the Eb/N0 is 9.42 dB.
I managed to solve this challenge shortly after it was published, and sent Jean-Michel a Jupyter notebook explaining my solution. Jean-Michel liked this approach and invited me to present my solution today at the conference. This presentation can be watched in the recording of the conference livestream.
I have now published a repository with all the material of my solution. Thanks to Jean-Michel for putting together this interesting and enjoyable challenge and to NI for providing a prize to make the challenge more attractive.
Yesterday we had a strong storm in Madrid at around 16:30 UTC. The storm was rather short but intense. Seeing the heavy rain, it occurred to me that I might be able to receive the 10 GHz beacon ED4YAE at Alto del León using my QO-100 groundstation (without moving the antenna).
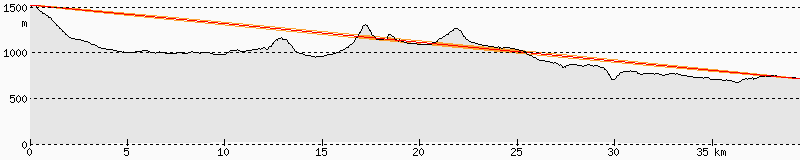
The 10 GHz beacon is 39.4 km away and the direct path to my station is obstructed by some hill in the middle, as shown in the link profile.
In the countryside just outside town it is possible to receive the beacon, probably because it diffracts on the hills. However, it is impossible for me to receive it directly from home, as there are too many tall buildings in the way.
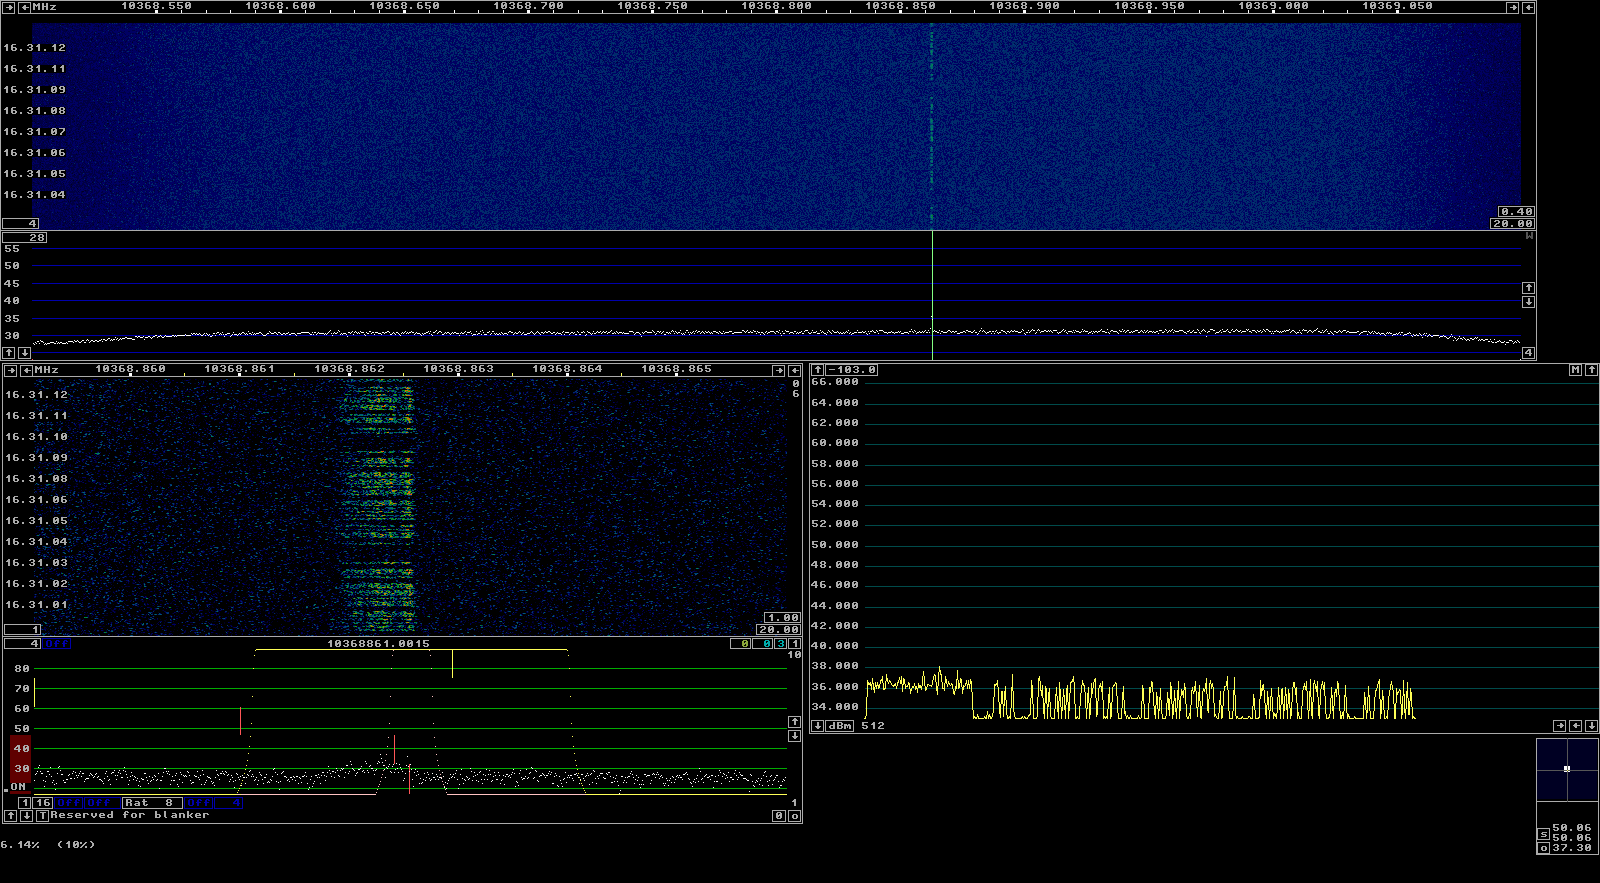
In fact, when I fired up my receiver as the storm raged, I was able to see the beacon signal, with a huge Doppler spread of some 700 Hz (20 m/s). The CW ID of the beacon was easy to copy.
ED4YAE -> EA4GPZ at 10 GHz via rain backscatter
Then I started recording the signal. As the rain got weaker, it started disappearing, until it faded away completely. This post is a short analysis of the scatter geometry and the recording.
Over the last few weeks I have been helping the Allen Telescope Array by calibrating the pointing of some of the recently upgraded antennas using the GNU Radio backend, which consists of two USRP N32x devices that are connected to the IF output of the RFCB downconverter. For this calibration, GPS satellites are used, since they are very bright, cover most of the sky, and have precise ephemerides.
The calibration procedure is described in this memo. Essentially, it involves pointing at a few points that describe a cross in elevation and cross-elevation coordinates and which is centred at the position of the GPS satellite. Power measurements are taken at each of these points and a Gaussian is fitted to compute the pointing error.
The script I am using is based on this script for the CASPER SNAP boards, with a few modifications to use my GNU Radio polarimetric correlator, which uses the USRPs and a software FX correlator that computes the crosscorrelations and autocorrelations of the two polarizations of two antennas. For the pointing calibration, only the autocorrelations are used to measure Stokes I, but all the correlations are saved to disk, which allows later analysis.
In this post I analyse the single-dish polarimetric spectra of the GPS satellites we have observed during some of these calibrations.
Yesterday, May 14th, at around 23:18 UTC the Tianwen-1 rover Zhurong safely landed on the Utopia Planitia region of Mars. To follow this event, AMSAT-DL made a 7 hour livestream of the orbiter signals as received by the 20m antenna in Bochum observatory. In this livestream we could see the signal losses caused by the manoeuvres of the deorbit burn and collision avoidance burn. Analysis of the telemetry decoded at Bochum shows more details about these manoeuvres. This post is a detailed report of the landing.
Some time ago I did a few experiments about pushing 2kbaud 8PSK and differential 8PSK through the QO-100 NB transponder. I didn’t develop these experiments further into a complete modem, but in part they served as inspiration to Kurt Moraw DJ0ABR, who has now made a QO-100 Highspeed Multimedia Modem application that uses up to 2.4 kbaud 8PSK to send image, files and digital voice. Motivated by this, I have decided to pick up these experiments again and try to up the game by cramming as much bits per second as possible into a 2.7 kHz SSB channel.
Now I have a definition for the modem waveform, and an implementation in GNU Radio of the modulation, synchronization and demodulation that is working quite well both on simulation and in over-the-air tests on the QO-100 NB transponder. The next step would be to choose or design an appropriate FEC for error-free copy.
In this post I give an overview of the design choices for the modem, and present the GNU Radio implementation, which is available in gr-qo100_modem.
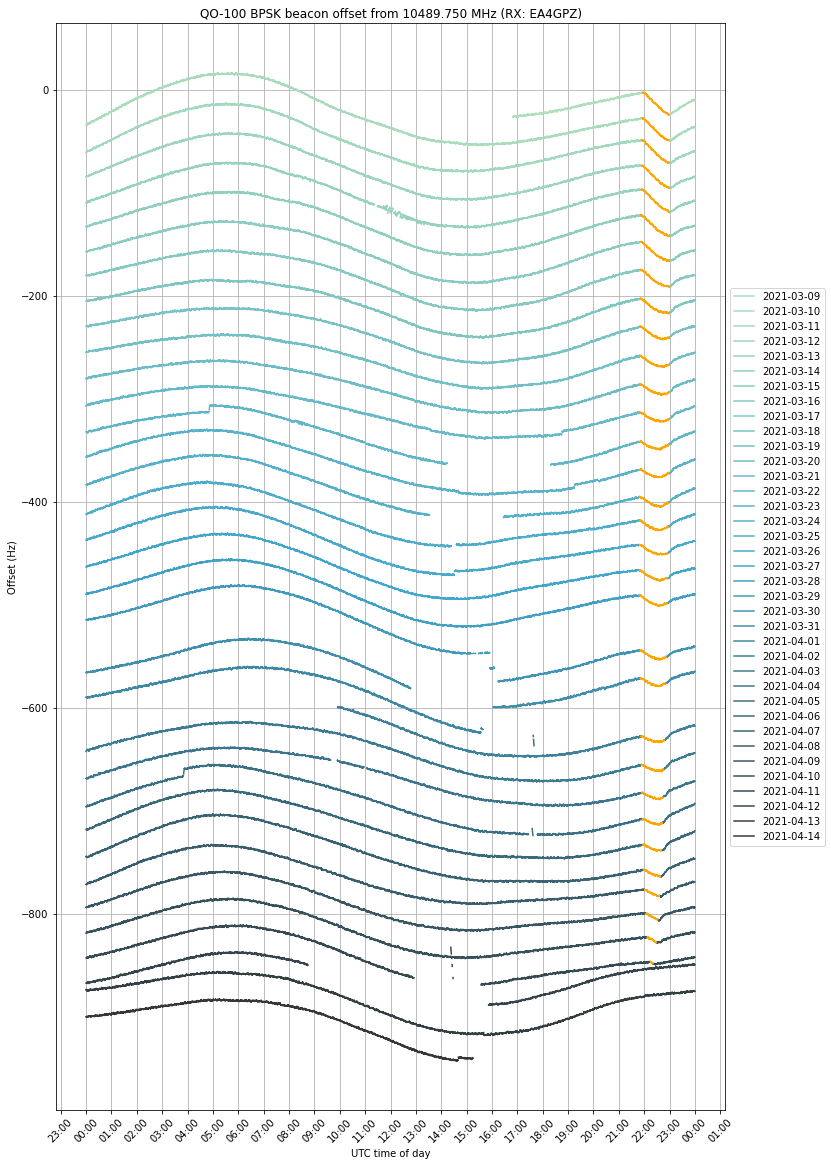
A few days ago, the spring eclipse season for Es’hail 2 finished. I’ve been recording the frequency of the NB transponder BPSK beacon almost 24/7 since March 9 for this eclipse season. In the frequency data, we can see that, as the spacecraft enters the Earth shadow, there is a drop in the local oscillator frequency of the transponder. This is caused by a temperature change in the on-board frequency reference. When the satellite exits the Earth shadow again, the local oscillator frequency comes back up again.
The measurement setup I’ve used for this is the same that I used to measure the local oscillator “wiggles” a year ago. It is noteworthy that these wiggles have completely disappeared at some point later in 2020 or in the beginning of 2021. I can’t tell exactly when, since I haven’t been monitoring the beacon frequency (but other people may have been and could know this).
A Costas loop is used to lock to the BPSK beacon frequency and output phase measurements at a rate of 100 Hz. These are later processed in a Jupyter notebook to obtain frequency measurements with an averaging time of 10 seconds. Some very simple flagging of bad data (caused by PLL unlocks) is done by dropping points for which the derivative exceeds a certain threshold. This simple technique still leaves a few bad points undetected, but the main goal of it is to improve the quality of the plots.
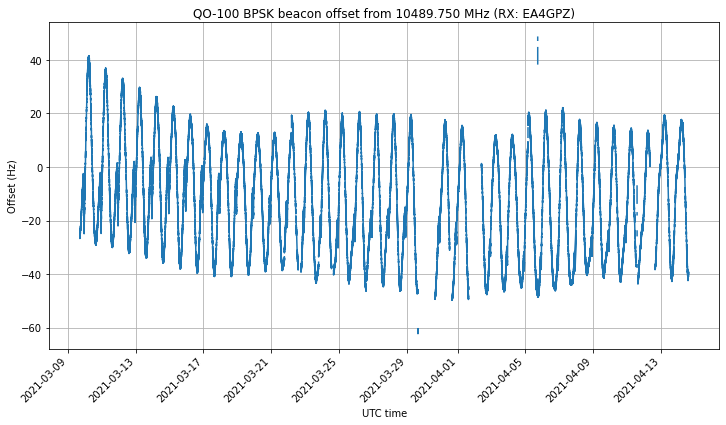
The figure below shows the full time series of frequency measurements. Here we can see the daily sinusoidal Doppler pattern, and long term effects both in the orbit and in the local oscillator frequency.
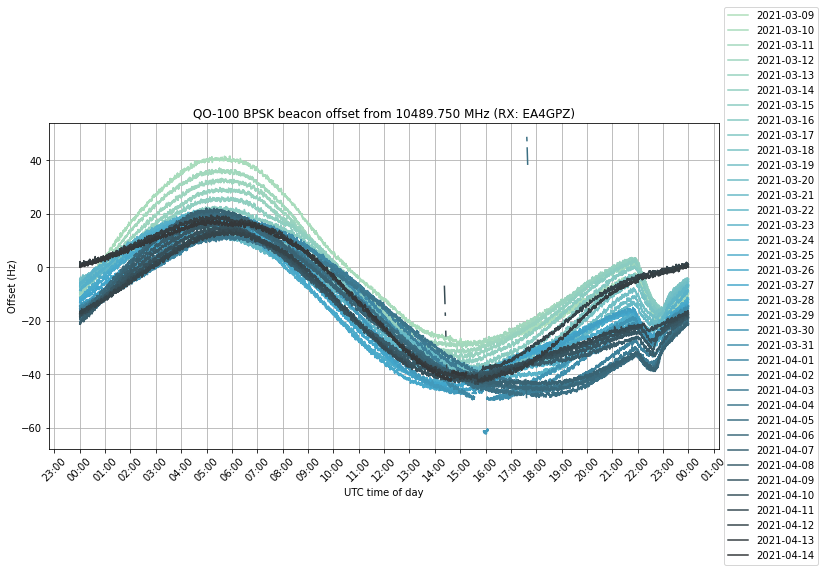
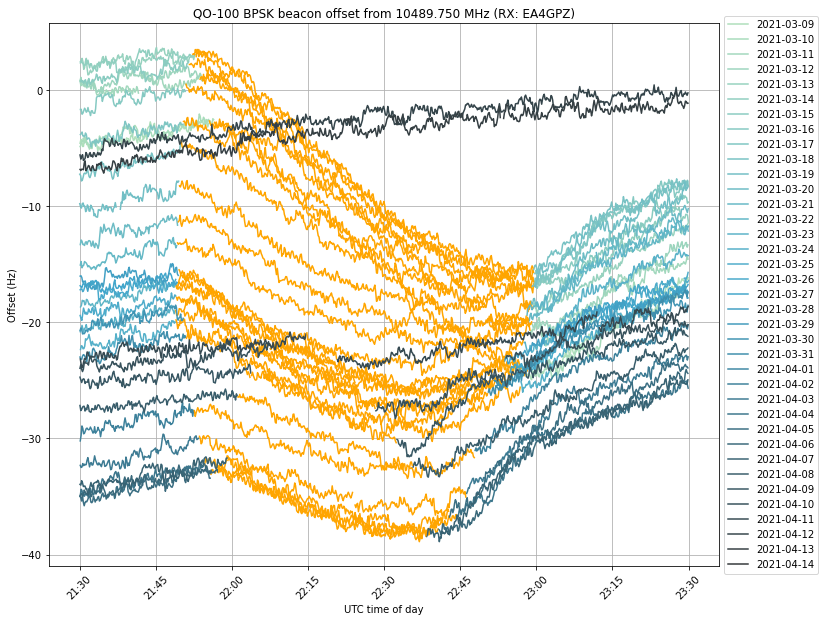
If we plot all the days on top of each other, we get the following. The effect of the eclipse can be clearly seen between 22:00 and 23:00 UTC.
By adding an artificial vertical offset to each of the traces, we can prevent them from lying on top of each other. We have coloured in orange the measurements taken when the satellite was in eclipse. The eclipse can be seen getting shorter towards mid-April and eventually disappearing.
We see that the frequency drop starts exactly as soon as the eclipse starts. In many days, the drop ends at the same time as the eclipse, but in other days the drop ends earlier and we can see that the orange curve starts to increase again near the end of the eclipse. This can be seen better in the next figure, which shows a zoom to the time interval when the eclipse happens, and doesn’t apply a vertical offset to each trace. I don’t have an explanation for this increase in frequency before the end of the eclipse.
The plots in this post have been done in this Jupyter notebook. The frequency measurements have been stored in this netCDF4 file, which can be loaded with xarray.
Some months ago I published the analysis of a BPSK pulse radar waveform that Scott Tilley VE7TIL had received through the transponder of Meridian 8 at a downlink frequency of 994 MHz. Now Roland Proesch DF3LZ has analyzed the same recording that I used, finding some different signal parameters. This has made me review my analysis, and it turns out that I made a mistake in finding the symbol rate of the signal. This post is an updated analysis, correcting my mistake.
Back in 2016, I became interested in Othernet‘s satellite filecasting service, which back then was called Outernet. Outernet was a start up company that offered a free global satellite service with which some internet contents such as weather updates or Wikipedia pages were broadcast. The main goal of the company was making this content available in developing countries, remote locations, and in general, in places that couldn’t afford an internet connection. Outernet started being popular with Amateur radio operators, hobbyists and makers, who saw it as an interesting project to set up at home for fun.
Most of the Outernet’s software stack was open source, and their receivers were some kind of embedded Linux system. However, the key parts of the receiver, which were the demodulator and the implementation of the filecasting protocol, were closed source and the protocols and specs they used were not documented publicly. Unhappy with this, I wrote in their forums asking if these software pieces could be open sourced. After receiving a negative reply, I decided to try to reverse-engineer all this, with the goal of writing some documentation and producing an open-source alternative implementation.