Now that the DSLWP-B eclipse images have become widespread, appearing even in some newspapers, I have taken the time to identify the features of the lunar surface that can be seen in two of the images. As with any Earth and Moon pictures of DSLWP-B, the part of the Moon that can be seen in these images belongs to the far side, with longitudes of approximately 100º E and 100º W (the division between the near side and the far side happens at 90º E and 90º W, and 0º is the middle of the near side).
I have compared the images with a simulation of the camera view done in GMAT. Using this simulation as a reference and these lunar surface maps as well as Google Moon, I have labelled the features that are visible in the images. The 4K lunar surface map from Celestia Motherlode has been used in GMAT, instead of the default, lower resolution map.
Occultation entry
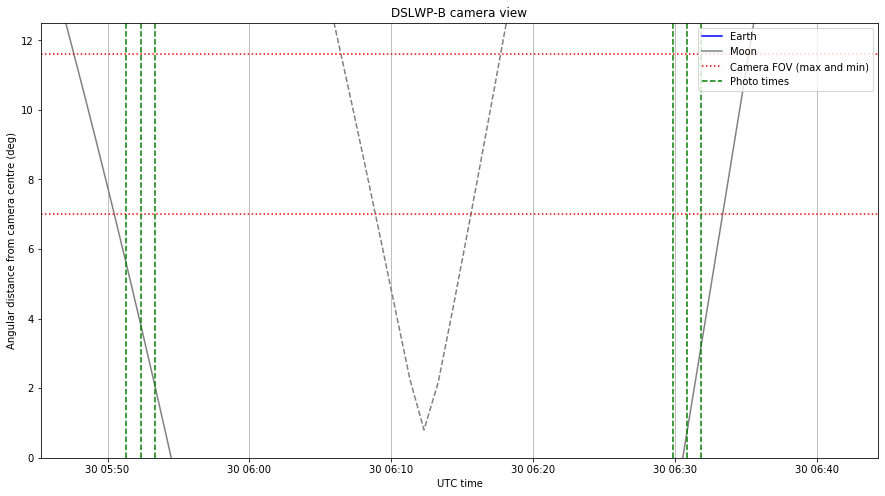
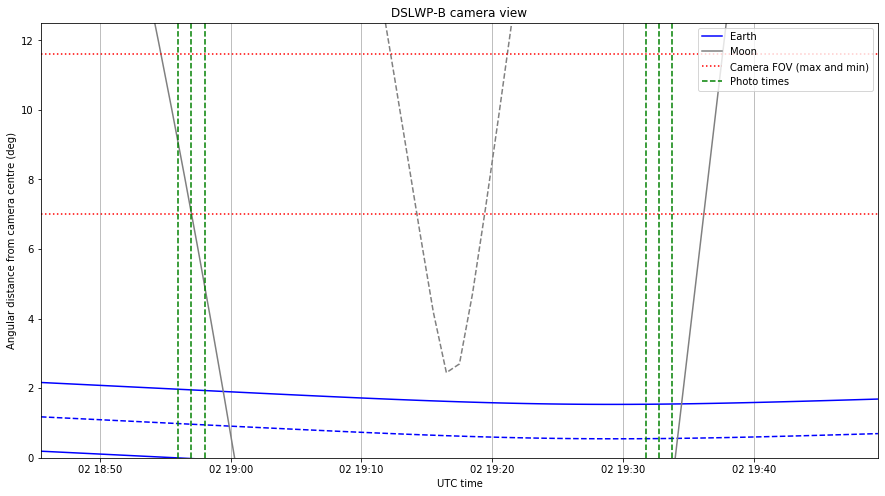
The figure below shows the GMAT camera view simulation for one of the images taken as DSLWP-B was hiding behind the Moon. The field of view in this figure is much larger than the field of view of the DSLWP-B Inory eye camera. The up direction is the normal to DSLWP-B’s orbit around the Sun (defined as the plane containing the position and velocity vectors with DLSWP-B with respect to the Sun). Therefore, it points approximately towards the north pole. DSWLP-B is moving towards the upper right corner of this image.
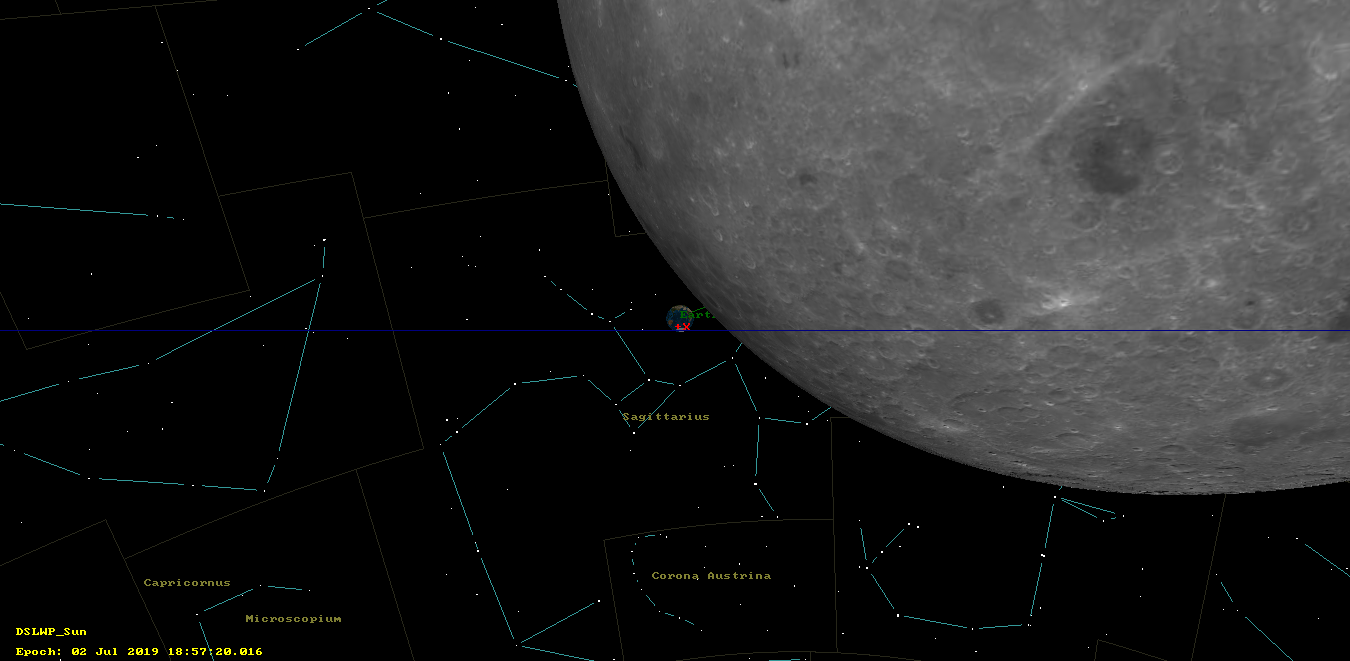
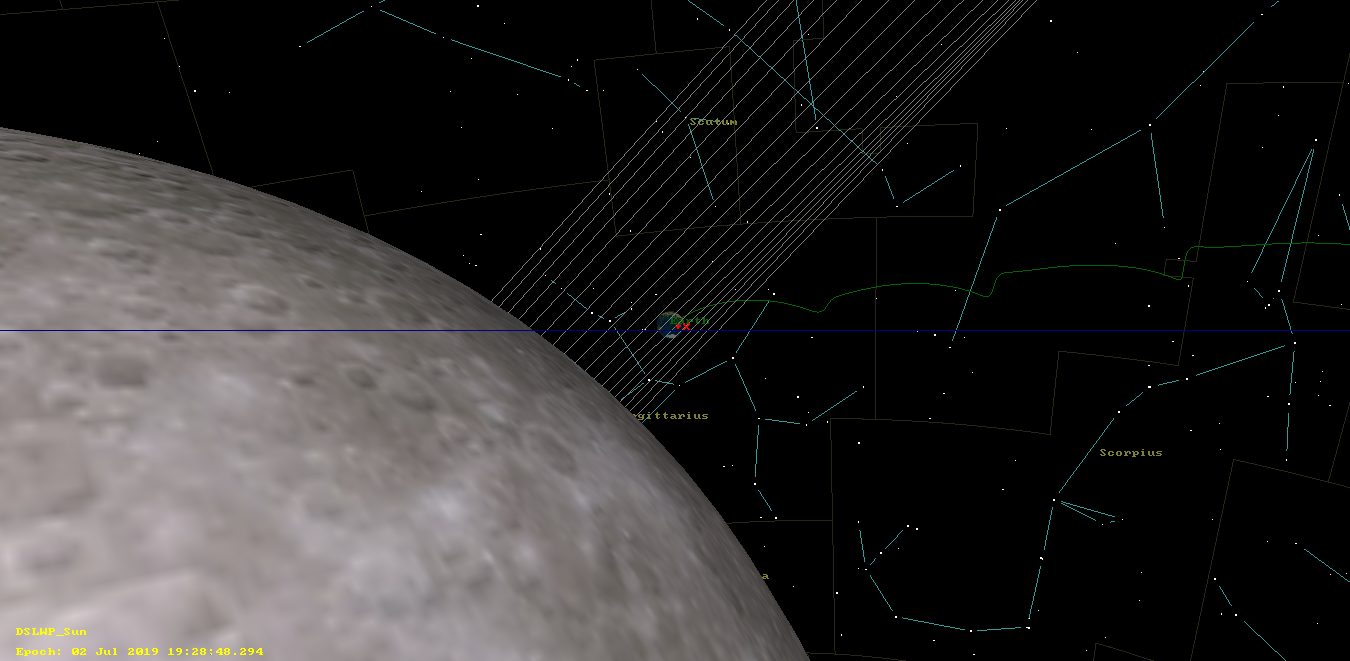
The figure belows shows the ground track view. The satellite has crossed the near side and is now starting to orbit over the far side, soon becoming hidden behind the Moon.

Image 0xE2, taken on 2019-07-02 18:57:20 is shown below. The image has been rotated to match the orientation of the GMAT camera view simulation.
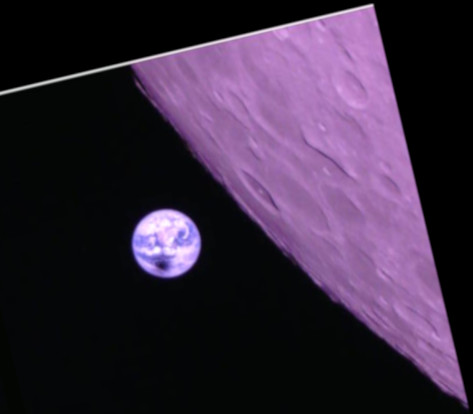
The craters that are visible in this image are labeled in the figure below. These belong to the Mare Australe region, and several well known craters such as Jenner and Lamb can be seen.

Tammo Jan Dijkema has done a similar exercise with image 0xE3, which was taken a minute after the image shown above. DSLWP-B has moved towards the upper right corner of the image, so that a larger portion of the lunar surface is visible.
Occultation exit
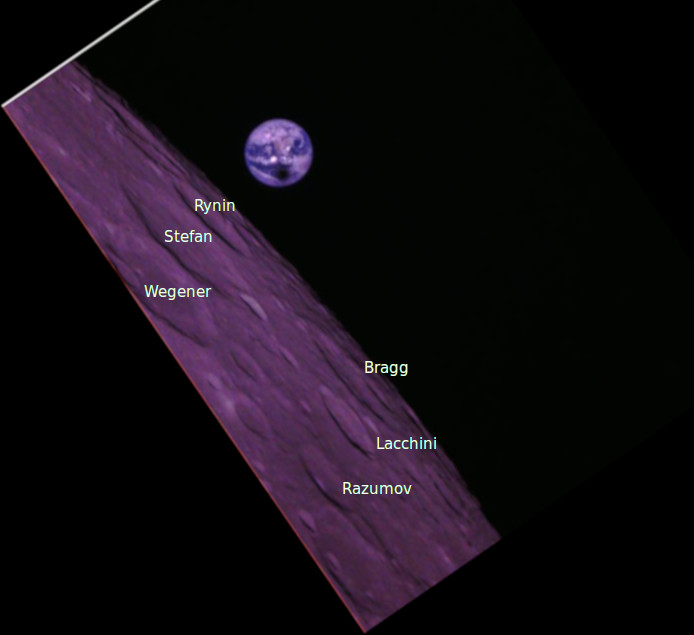
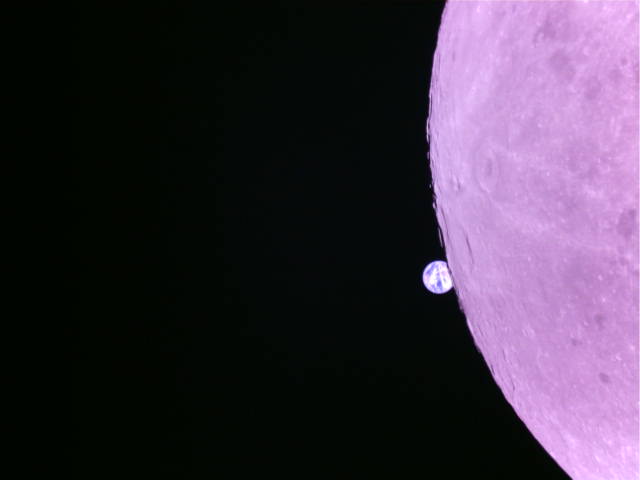
The figure below shows the GMAT camera view simulation corresponding to image 0xE5, which was taken shortly after DSLWP-B exited the occultation, so that the Earth was visible again.
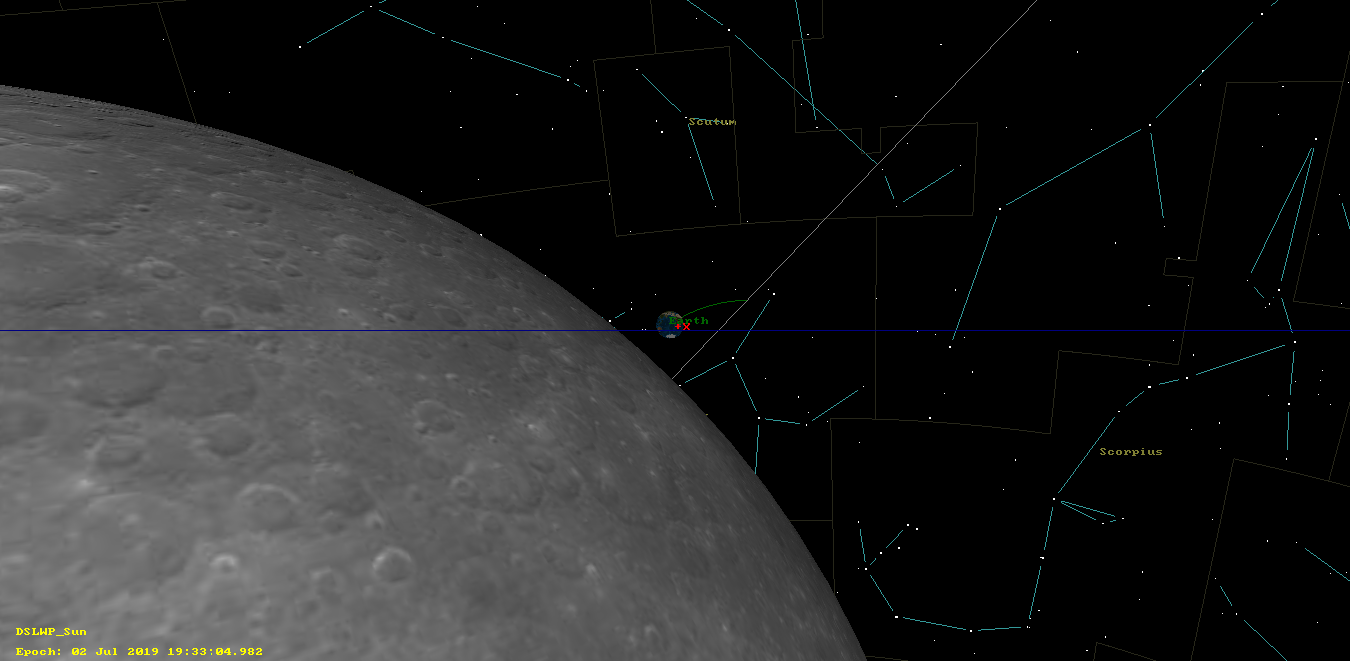
Below we see the ground track corresponding to this image. The satellite has crossed the far side of the Moon in a south to north direction and soon will cross over to the near side.

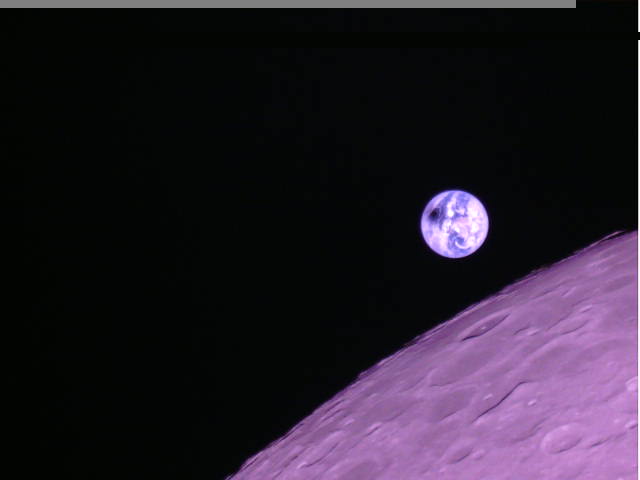
The figure below is image 0xE5, which was taken on 2019-07-02 19:33:05. It has been rotated to match the orientation of the GMAT simulation.
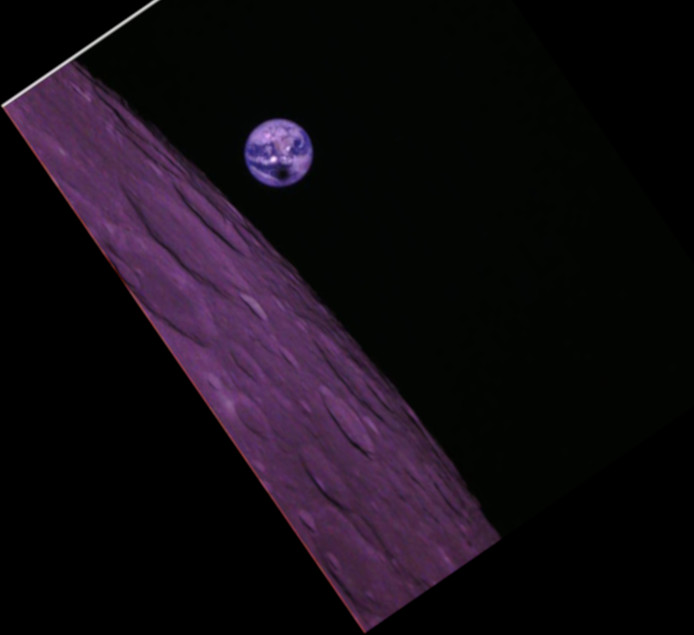
The craters are labelled in the figure below. Important craters in the Coulomb-Sarton basin such as Stefan and Bragg are visible. An image of this region with the craters labelled can be seen here.
