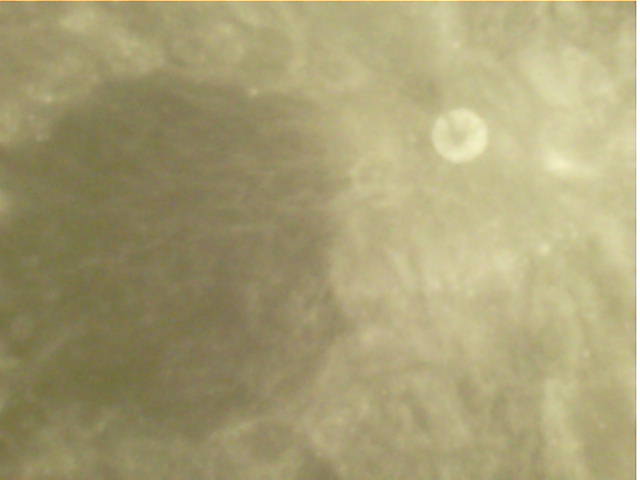
In my last posts about DSLWP-B, I have been showing all the images of the lunar surface that were taken by the satellite during the last weeks of the mission, and tried to identify to which area of the Moon each image corresponded. For several of them, I was able to give a good identification using Google Moon, but for many of the latest images I was unable to find an identification, since they show few or none characteristic craters.
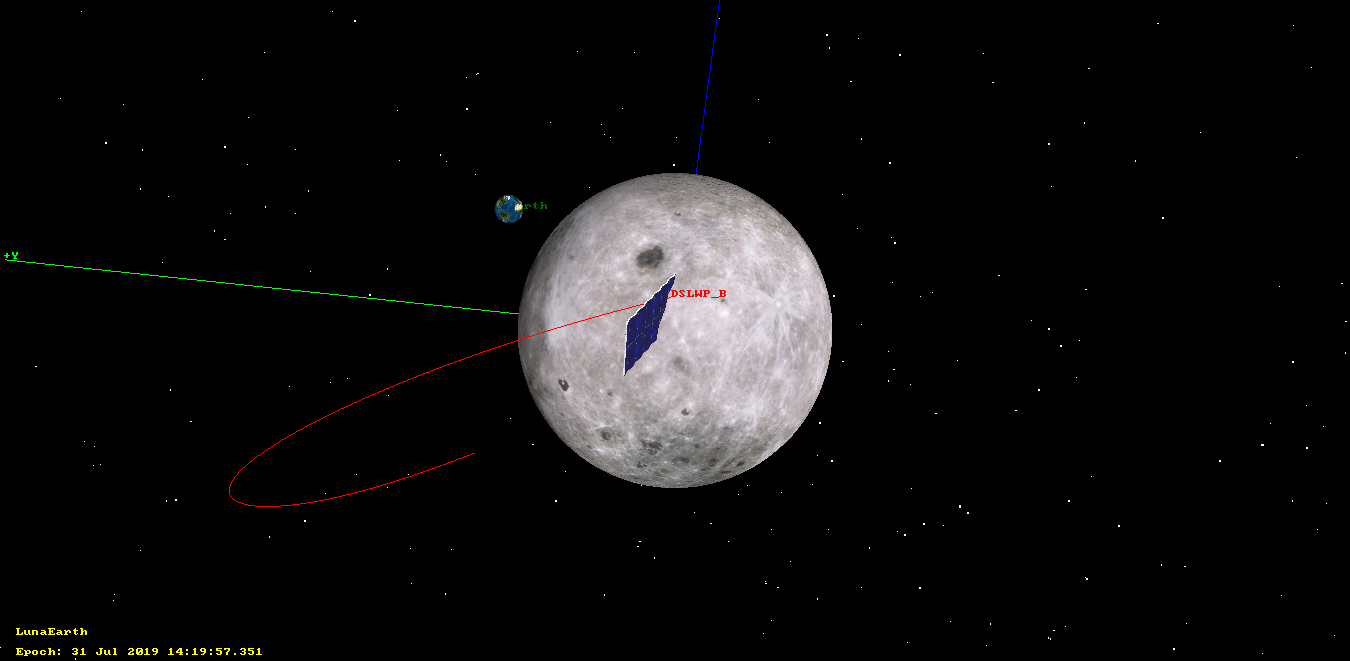
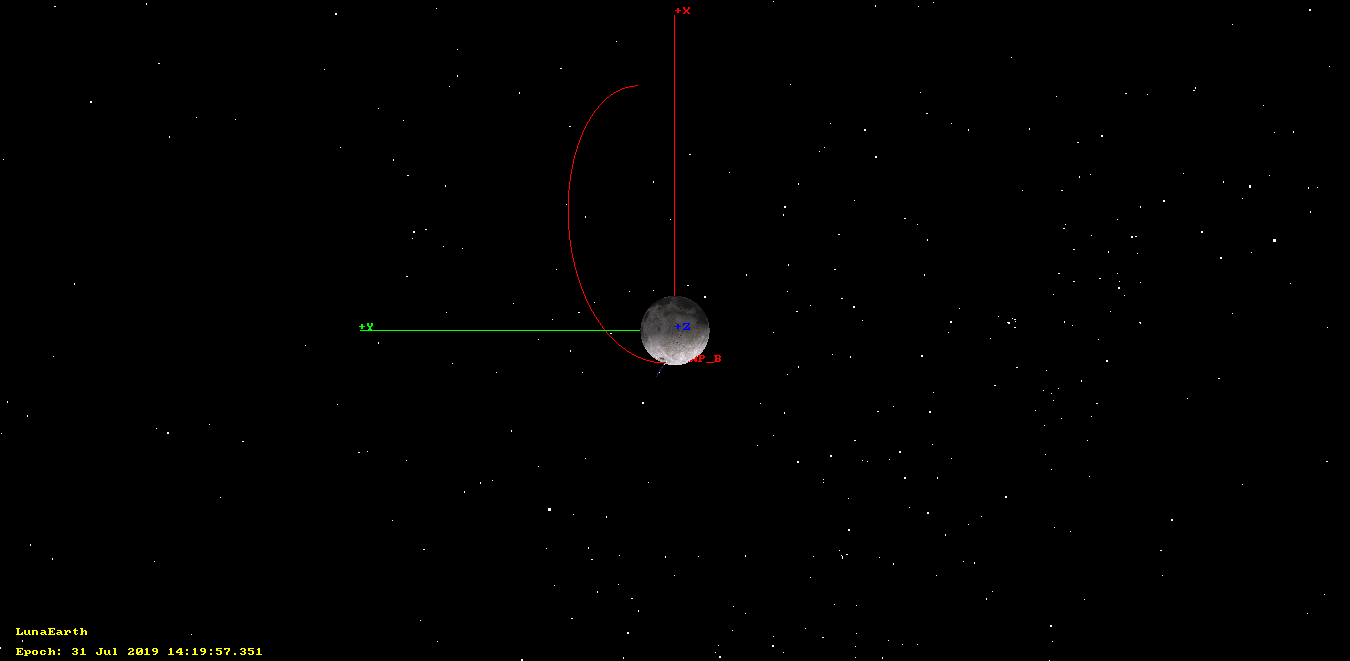
Thus, for these images I only gave a rough prediction of which area of the Moon was imaged by using GMAT and the published ephemeris from dslwp_dev. This doesn’t take into account camera pointing, orbit or shutter time errors.
Phil Stooke has become interested in this and he has managed to identify many of the images, even some containing very little detail, which I find impressive. No wonder, Phil is the author of several atlases of space exploration of the Moon and Mars, so he knows a lot of lunar geography.
Phil tells me that he has used Quickmap, which is a very nice tool that I didn’t know of. It is much more powerful than Google Moon. He recommends to switch to an equidistant cylindrical projection and set as a basemap layer the “WAC mosaic (no shadows) map”, which contains images with the sun directly overhead. This resembles the images taken by DSLWP-B better, since these are always taken with the sun at a high elevation, because the camera always points away from the sun. It is interesting to see how the appearance of the surface changes between the “no shadows” and “big shadows” maps.
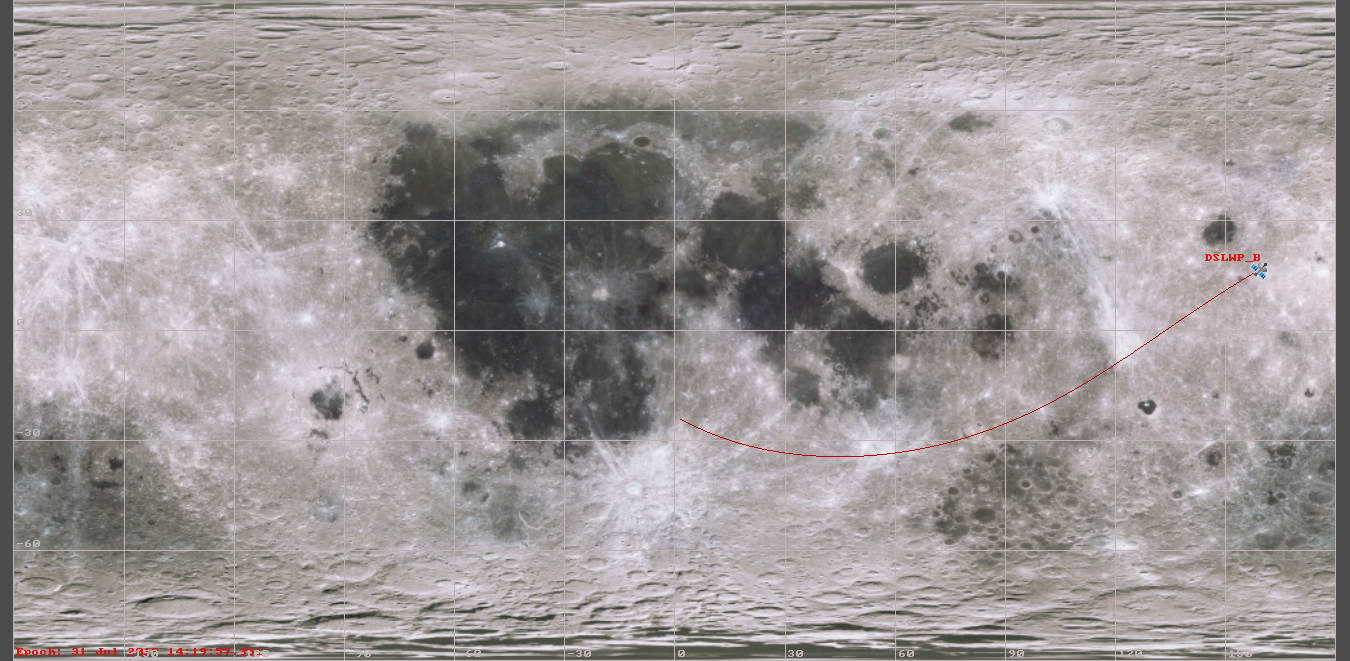
In this post I show the locations of the images identified by Phil.