This year I submitted a challenge track based around a DVB-S2 signal to the GRCon CTF (see this post for the challenges I sent in 2022). The challenge description was the following.
I was scanning some Astra satellites and found this interesting signal. I tried to receive it with my MiniTiouner, but it didn’t work great. Maybe you can do better?
Note: This challenge has multiple parts, which can be solved in any order. The flag format is flag{...}.
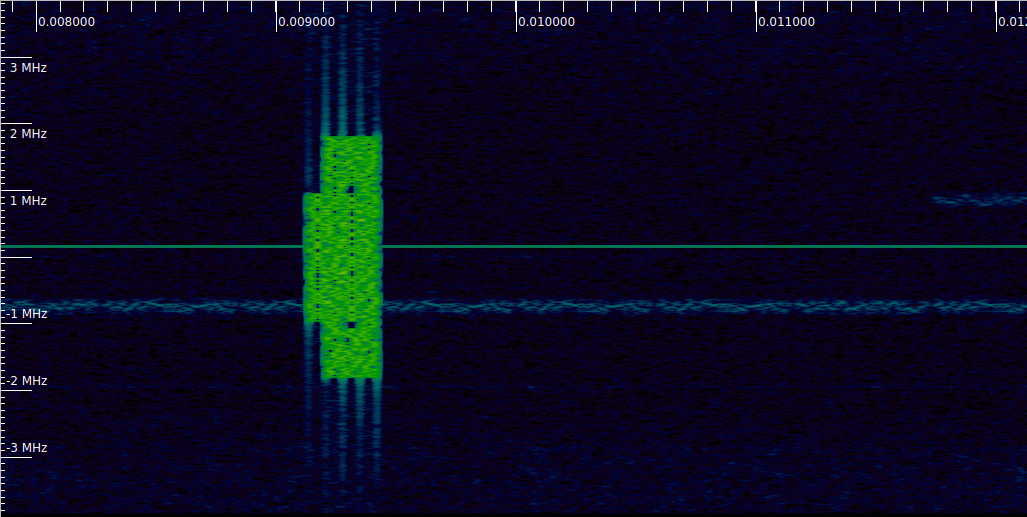
A single SigMF recording with a DVB-S2 signal sampled at 2 Msps at a carrier frequency of 11.723 GHz was given for the 10 flags of the track. The description and frequency were just some irrelevant fake backstory to introduce the challenge, although some people tried to look online for transponders on Astra satellites at this frequency.
The challenge was inspired by last year’s NTSC challenge by Clayton Smith (argilo), which I described in my last year’s post. This DVB-S2 challenge was intended as a challenge with many flags that can be solved in any order and that try to showcase many different places where one might sensibly put a flag in a DVB-S2 signal (by sensibly I mean a place that is actually intended to transmit some information; surely it is also possible to inject flags into headers, padding, and the likes, but I didn’t want to do that). In this sense, the DVB-S2 challenge was a spiritual successor to the NTSC challenge, using a digital and modern TV signal.
Another source of motivation was one of last year’s Dune challenges by muad’dib, which used a DVB-S2 Blockstream Satellite signal. In that case demodulating the signal was mostly straightforward, and the fun began once you had the transport stream. In my challenge I wanted to have participants deal with the structure of a DVB-S2 signal and maybe need to pull out the ETSI documentation as a help.
I wanted to have flags of progressively increasing difficulty, keeping some of the flags relatively easy and accessible to most people (in any case it’s a DVB-S2 signal, so at least you need to know which software tools can be used it to decode it and take some time to set them up correctly). This makes a lot of sense for a challenge with many flags, and in hindsight most of the challenges I sent last year were quite difficult, so I wanted to have several easier flags this time. I think I managed well in this respect. The challenge had 10 flags, numbered more or less in order of increasing difficulty. Flags #1 through #8 were solved by between 7 and 11 teams, except for flag #4, which was somewhat more difficult and only got 6 solves. Flags #9 and #10 were significantly more difficult than the rest. Vlad, from the Caliola Engineering LLC team, was the only person that managed to get flag #10, using a couple of hints I gave, and no one solved flag #9.
When I started designing the challenge, I knew I wanted to use most of the DVB-S2 signal bandwidth to send a regular transport stream video. There are plenty of ways of putting flags in video (a steady image, single frames, audio tracks, subtitles…), so this would be close to the way that people normally deal with DVB-S2, and give opportunities for many easier flags. I also wanted to put in some GSE with IP packets to show that DVB-S2 can also be used to transmit network traffic instead of or in addition to video. Finally, I wanted to use some of the more fancy features of DVB-S2 such as adaptive modulation and coding for the harder flags.
To ensure that the DVB-S2 signal that I prepared was not too hard to decode (since I was putting more things in addition to a regular transport stream), I kept constantly testing my signal during the design. I mostly used a Minitiouner, since perhaps some people would use hardware decoders. I heard that some people did last year’s NTSC challenge by playing back the signal into their hotel TVs with an SDR, and for DVB-S2 maybe the same would be possible. Hardware decoders tend to be more picky and less flexible. I also tested gr-dvbs2rx and leandvb to have an idea of how the challenge could be solved with the software tools that were more likely to be used.
What I found, as I will explain below in more detail, is that the initial way in which I intended to construct the signal (which was actually the proper way) was unfeasible for the challenge, because the Minitiouner would completely choke with it. I also found important limitations with the software decoders. Basically they would do some weird things when the signal was not 100% a regular transport stream video, because other cases were never considered or tested too thoroughly. Still, the problems didn’t get too much in the way of getting the video with the easier flags, and I found clever ways of getting around the limitations of gr-dvbs2rx and leandvb to get the more difficult flags, so I decided that this was appropriate for the challenge.
In the rest of this post I explain how I put together the signal, the design choices I made, and sketch some possible ways to solve it.