Each GNSS system uses their own timescale for all the calculations. What this means is slightly difficult to explain, since anything involving “paper clocks” is conceptually tricky. In essence, the system, as part of the orbit and clock determination, maintains a timescale (paper clock) to which the ephemeris are referenced. This timescale is usually related to some atomic clocks in the countries that manage the GNSS system, and these clocks often participate in the realization of UTC, so that in the end this GNSS timescale is traceable to UTC. For instance, GPS time is related to UTC(USNO), and GST, the Galileo system time, is related to a few atomic clocks in Europe that are realizations of UTC.
Since all the information for a single GNSS system is self-consistent with respect to the timescale it uses, a receiver using a single system to compute position and velocity does not really care about the GNSS timescale. Everything will just work. However, when the receiver needs to compute UTC time accurately (for instance to produce a 1PPS output that is aligned to UTC) or to mix measurements from several GNSS systems, then it needs to handle the different GNSS timescales involved, and transfer all the measurements to a common timescale (and in the case of measuring UTC time or producing a 1PPS output, relating this timescale to UTC).
As part of their broadcast ephemeris, GNSS systems broadcast an estimate of the offset between the system timescale and UTC (this estimate is just a forecast; the true value of UTC is only known a posteriori, when the BIPM publishes its monthly Circular T). Additionally, some systems also broadcast the offset between their timescale and the timescale of another system. For example, Galileo broadcasts the offset GST-GPST, the difference between Galileo system time and GPS time. This is intended as a help to receivers that want to combine measurements from both systems. However, these values are somewhat inaccurate, so it is common for receivers to ignore them, and determine the offsets on their own (this is done by adding extra variables called intersystem biases to the system of equations solved to obtain the navigation solution). This trick only works for combining measurements of different systems. In the case of UTC, receivers do not have any way of directly measuring UTC, so they must trust the broadcast message. Alternatively, some receivers offer an option to align their 1PPS output to a GNSS timescale such as GPST.
These days, most GNSS systems, including GPS and Galileo usually keep their timescales within a few nanoseconds of UTC. According to the specifications of each system, the relation to UTC is much loose. GPS time promises to be synchronized to UTC(USNO) with a maximum error of 1 microsecond. GLONASS time only promises 1 millisecond synchronization to UTC. GST is supposed to be within 50 ns of UTC, and Beidou time within 100 ns. However, if timekeeping is done correctly, there is no reason why the GNSS timescale should drift from UTC by more than a couple nanoseconds (which is the typical drift of physical realizations of UTC). Receivers should assume that the offsets can be as large as the maximum errors in the specification, but might occasionally freak out if they see an offset which is large, either because of bugs if this case was never tested, as in practice the offsets are typically small, or because it suspects an error in its own measurements.
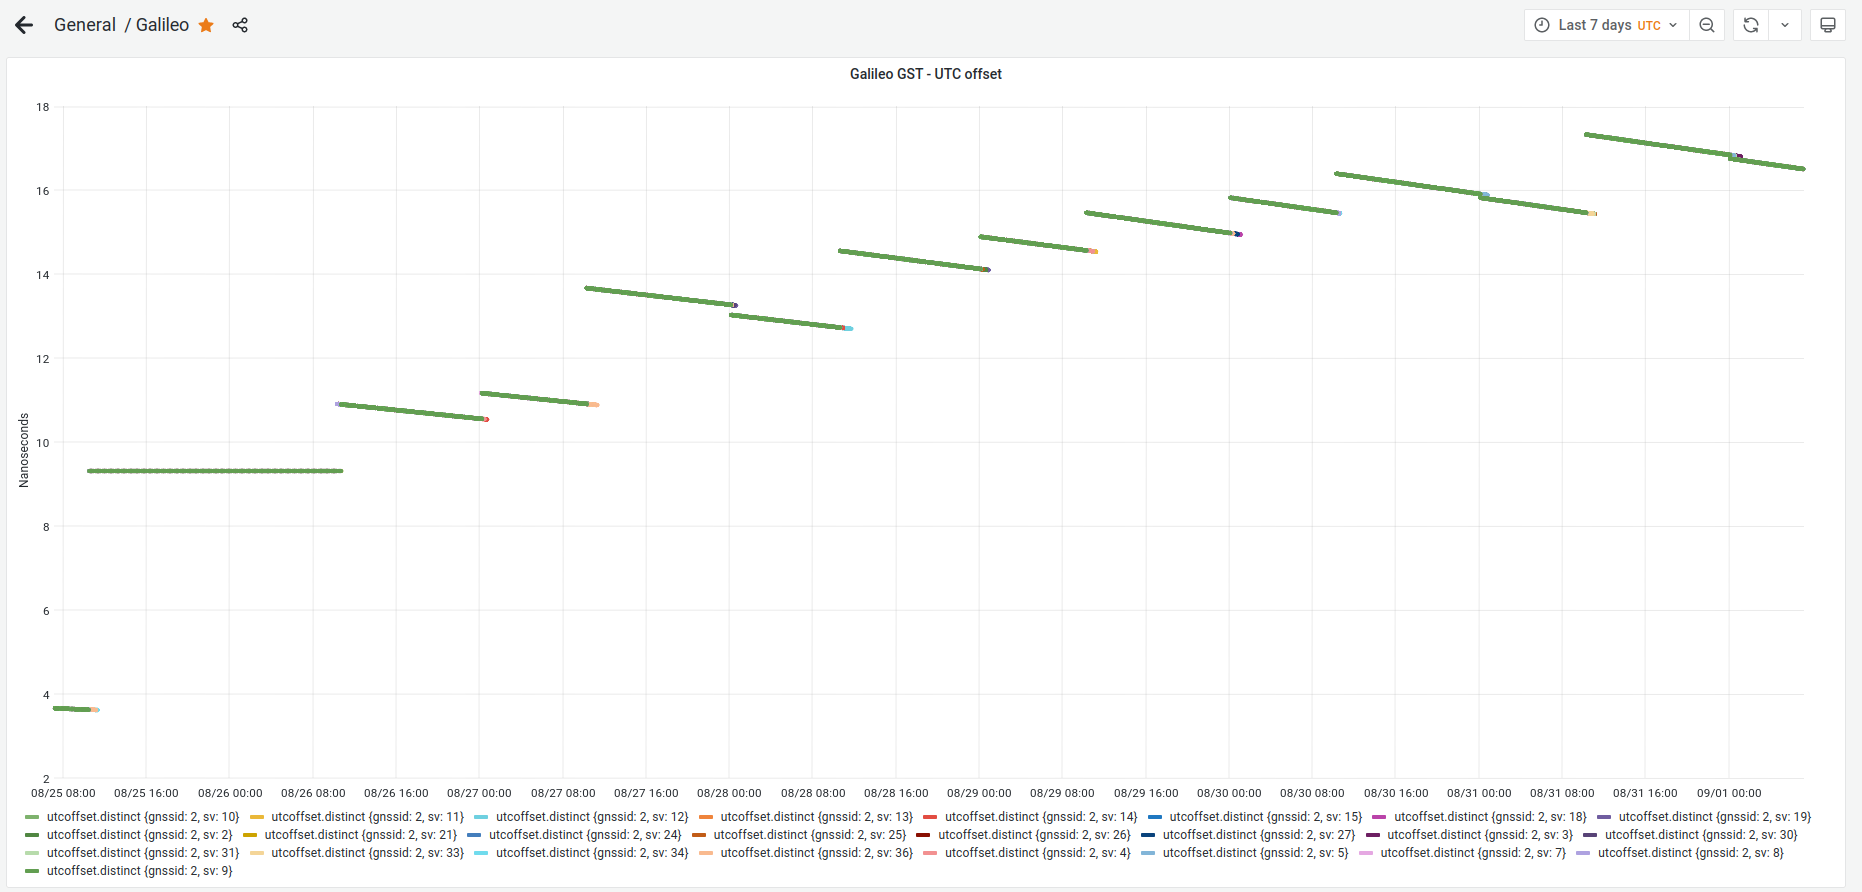
A few days ago, some people in the time-nuts mailing list, and Bert Hubert from galmon.eu noticed that the GST-UTC, the difference between Galileo system time and UTC, had increased to 17 ns and remain around this value during the end of August. This is highly unusual, because GST-UTC is usually smaller than 2 or 3 ns.
galmon.eu provides a public Grafana dashboard where this anomaly can be seen, though the dashboard (or web browser) tends to choke if we request to plot more than one week worth of data.
When hearing about this on Friday, I got interested and commented some ways in which this could be researched further. I also wondered: is the GST-UTC offset actually large, or is it just that the offset estimate in the navigation message is wrong? In this post I explore one of my ideas.