Queqiao is the communications relay satellite for the Chang’e 4 Chinese lunar lander mission to the far side of the Moon. It is in a halo orbit around the Earth-Moon Largrange L2 point and provides communications to the lander in Von Kármán crater.
Queqiao transmits telemetry in S-band, using the frequency 2234.5 MHz. The modulation and coding is similar to other recent Chinese probes, such as Chang’e 5 and Tianwen-1. Here I report an interesting bug that I found in the Reed-Solomon encoding performed by Queqiao.
Back in September, I showed how to decode the telemetry signal from Voyager 1 using a recording made with the Green Bank Telescope in 2015 by the Breakthrough Listen project. The recording was only 22.57 seconds long, so it didn’t even contain a complete telemetry frame. To study the contents of the telemetry, more data would be needed. Often we can learn things about the structure of the telemetry frames by comparing several consecutive frames. Fields whose contents don’t change, counters, and other features become apparent.
Some time after writing that post, Steve Croft, from BSRC, pointed me to another set of recordings of Voyager 1 from 16 July 2020 (MJD 59046.8). They were also made by Breakthrough Listen with the Green Bank Telescope, but they are longer. This post is an analysis of this set of recordings.
DART, the Double Asteroid Redirection Test, is a NASA mission that launched last Wednesday from Vandenberg. The goal of this mission is to crash the spacecraft into the small asteroid Dimorphos, allowing us to measure the small change in the orbit of the asteroid caused by the impact.
From the communications perspective, this spacecraft is the first to use a Spiral Radial Line Slot Array (RLSA) as high-gain antenna. Details about the antenna design can be seen in this paper. The paper shows that antenna polarization is LHCP. Most DSN communications use RHCP, although there are a few notable exceptions (for instance Emirates Mars Mission), and the DSN stations are equipped to handle both polarizations. I’m not sure if DART is indeed using LHCP or if this is just a matter of the convention in the definition of the polarization used in the paper (there are actually two opposite conventions to define the sense of circular polarization).
A few hours after launch, as the spacecraft passed over Europe, Miguel CT1BYM and Iban EB3FRN recorded the X-band telemetry signal from DART at 8421.79 MHz. This post is a first analysis of the signal.
On November 8, the Tianwen-1 orbiter made a manoeuvre to move itself to the remote sensing orbit, as reported by Chinese media. This orbit is the final orbit in the mission, as depicted in this figure from Wikipedia. The main goal of this orbit is to study the geophysical properties of Mars with all the orbiter instruments (see this paper) and to continue acting as a communications relay for the rover Zhurong.
As usual, AMSAT-DL has been collecting telemetry from Tianwen-1 with the 20 metre antenna at Bochum observatory, including spacecraft state vectors. This allows us to study the orbit change manoeuvre and the properties of the remote sensing orbit. This post is a first look at the state vector data.
In my previous post I presented a description of the X-band telemetry of Lucy, including a GNU Radio decoder, some recordings from the Allen Telecope Array, and an analysis of some of the telemetry received in the two days following the launch. This is a short post with some updates about the telemetry analysis of the Lucy mission.
Lucy is a spacecraft that will study the Trojan asteroids, during a twelve year mission. It was launched last Saturday at 9:34 UTC from Cape Canaveral on an Atlas V rocket. Its telemetry downlink is on X-band, at a frequency of 8445.768 MHz.
Iban Cardona EB3FRNmade a 30 minute recording of the telemetry downlink at 19:00 UTC on Saturday, as the spacecraft first appeared over Europe after launch. r00t.cz did a brief analysis of this recording overnight, and then published some more details about the telemetry data. On Sunday, at 8:52 UTC, I did a long recording with one of the dishes in the Allen Telescope Array. This recording lasts 3 hours 26 minutes, and ends when the spacecraft set below the 16 degree elevation mask of the ATA. In this post I give a first analysis of the telemetry data in both recordings.
The recording done at ATA can be downloaded from the following datasets in Zenodo:
As you may have seen in my last post, lately I have been reviewing some of data we have from Tianwen-1. In the days following the landing of Zhurong, back in May, we had so much data in our hands that I couldn’t post about it in a timely manner. We were wondering if we could use this data to plan for a number of experiments with the 20 meter antenna at Bochum observatory. These included trying to receive data from the rover relayed by the orbiter, and trying to detect the rover’s direct X-band link to Earth. We didn’t manage to do any of these, unfortunately, as they had a great deal of luck involved.
During the summer I’ve been involved in several activities such as collaborating with the SETI Institute and BSRC REU summer student programmes by teaching some GNU Radio lessons, and preparing material for GRCon21 (a talk, a workshop and paper). Now I have more time at hand, so it’s good to revisit this data. In this post I’ll look at Tianwen-1’s orbit after the release of the lander.
It has been a while since the last time I wrote an update about Tianwen-1’s attitude. In that post I showed that Tianwen-1 had changed to a sun angle of 0 degrees with respect to the spacecraft’s X axis on 2020-10-22. Since then, nothing changed, even after the spacecraft arrived to Mars orbit on February 2021, so I have been sloppy and ignored the ADCS telemetry for quite a while.
As you may have heard, the 20 metre antenna at Bochum observatory had a failure at the beginning of June due to a thunderstorm. It has been under repair until the end of August, when it became operational again. As AMSAT-DL has now returned to receive telemetry from Tianwen-1 at Bochum, I am now reviewing the new data to see if anything interesting might have happened in the last months.
When plotting the new data I have learned that Tianwen-1 changed attitude during the release of the lander on May 14, and has maintained this new attitude until the present day.
Today is the 44th anniversary of the launch of Voyager 1, so I want to celebrate by showing how to decode the Voyager 1 telemetry signal using GNU Radio and some Python. I will use a recording that was done back in 30 December 2015 with the Green Bank Telescope in the context of the Breakthrough Listen project. Most of the data from this project is open data and can be accessed through this portal.
In contrast to other posts about deep space probes in this blog, which are of a very specialized nature, I will try to keep this post accessible to a wider audience by giving more details about the basics. Those interested in learning further can refer to the workshop “Decoding Interplanetary Spacecraft” that I gave in GRCon 2020, and also take a look at other posts in this blog.
It’s been a while since the last time I posted about Chang’e 5, back at the end of January. Since then we have been occasionally keeping an eye on it with the Allen Telescope Array, and Scott Tilley VE7TIL has also been monitoring with its home station. Until now, the spacecraft has spent its time slowly drifting around the Sun-Earth L1 point. However, it appears that now it is on the move.
The observations I’ve done last weekend from ATA, as well as reports from Scott and other observers show that it has deviated significantly from the ephemerides made by Bill Gray using our radio observations. This is not so surprising, because we haven’t been maintaining those ephemerides with new observations through part of July and all August. What is more surprising is that now the spacecraft’s right ascension and declination is changing rather fast.
The following are the observations I took with the ATA this weekend, using the Chang’e 5 telemetry signal at 8486.3 MHz.
Timestamp (UTC)
RA (h)
DEC (deg)
2021-08-28 21:00
7.931
14.73
2021-08-29 16:00
8.117
14.05
2021-08-29 21:30
8.150
13.80
This represents an angular movement of 3.25 deg per day, which is a lot if we compare it with the ephemerides around the end of July, which had an angular movement of 0.43 deg per day.
Still we don’t have enough data to fit a good trajectory. It is uncertain whether Chang’e 5 has manoeuvred or is simply being ejected out of the L1 point (orbits around the Langrage points are typically unstable and require station-keeping). We will keep gathering more data points to try to fit a better trajectory.
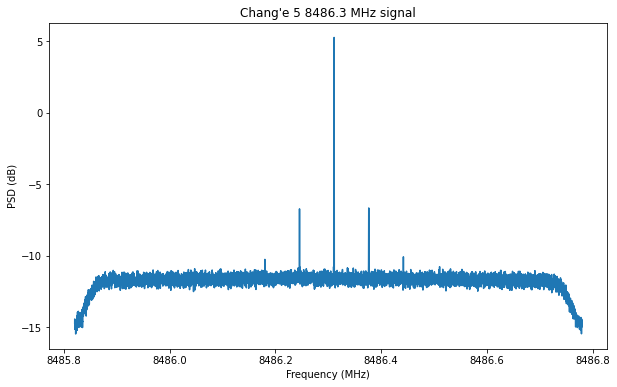
Yesterday I observed that the signal strength was really good. The figure below shows the spectrum of the signal. The two smaller spikes to the sides of the carrier are the data sidebands, which have an SNR of approximately 5 dB. The spacecraft is still transmitting at 512 baud.
Chang’e 5 signal on 2021-08-29
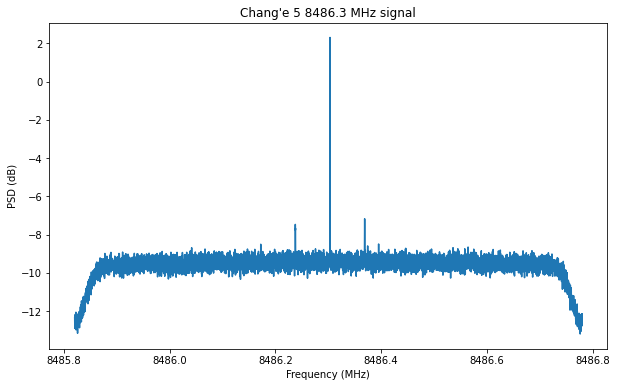
In comparison, this is the signal on Saturday, which is a few dB weaker.
Chang’e 5 signal on 2021-08-28
And here is the signal on 2021-07-31, which is the previous observation I made.
Chang’e 5 signal on 2021-07-31
These last two spectra are more typical of the signal strengths we’ve been seeing with the ATA (using a single 6 metre dish) since Chang’e 5 arrived the neighbourhood of the L1 point.
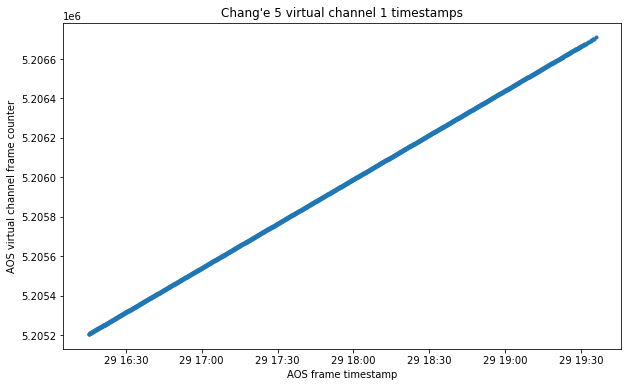
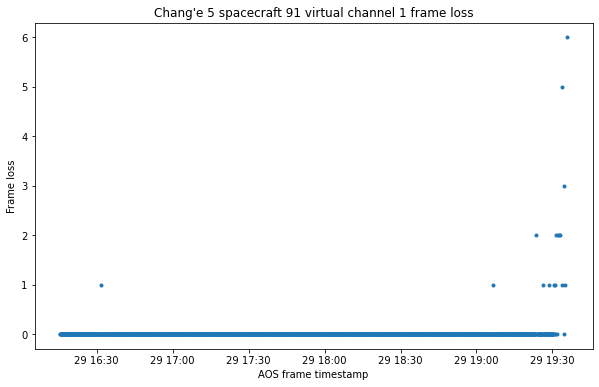
Since the signal was so good, I left the ATA recording IQ data in order to decode the telemetry later. Unfortunately the spacecraft movement was fast enough that it exited the beam of the dish in approximately 3 hours (I was tracking a constant right ascension and declination). Still, during these 3 hours we got very few lost frames, as shown in these figures.
The telemetry data in the different APIDs in virtual channel 1 (which is the only virtual channel in use) looks very similar to the data decoded on 2021-01-24. The only noteworthy aspect is that APID 1029 is missing in the data from 2021-08-29. As during the end of January, the data looks rather static, with some periodic changes in channels that could correspond to temperature cycles.
The full plots of the decoded data can be seen in this Jupyter notebook, and the decoded data can be found here.
