In my last post, I spoke about the possibility of imaging the July 2 solar eclipse using the Inory eye camera on-board DSLWP-B. After discussing the plans for the observations with Wei Mingchuan BG2BHC, we have decided to activate the DSLWP-B Amateur payload during the following intervals:
- 2019-06-30 05:30 to 07:30
- 2019-07-01 05:30 to 07:30
- 2019-07-02 18:00 to 20:00
- 2019-07-03 06:00 to 08:00
- 2019-07-04 06:30 to 08:30
- 2019-07-05 07:30 to 09:30
The camera will be used in 2x zoomed mode, which has a field of view of 14×18.5, degrees. Using the zoomed mode requires careful planning, since part of the Moon needs to appear inside the image, to help the camera auto-exposure algorithm, but the Moon shouldn’t hide the Earth.
The June 30 activation will be used to test the camera, taking images of the Moon in similar positions to those on July 2. The Earth will not be in view of the camera on this day, but these tests will serve to validate camera pointing, exposure, and satellite ephemeris errors.
The following imaging times have been proposed:
- 2019-06-30 05:51:20
- 2019-06-30 05:52:20
- 2019-06-30 05:53:20
- 2019-06-30 06:29:50
- 2019-06-30 06:30:50
- 2019-06-30 06:31:50
- 2019-07-02 18:56:00
- 2019-07-02 18:57:00
- 2019-07-02 18:58:00
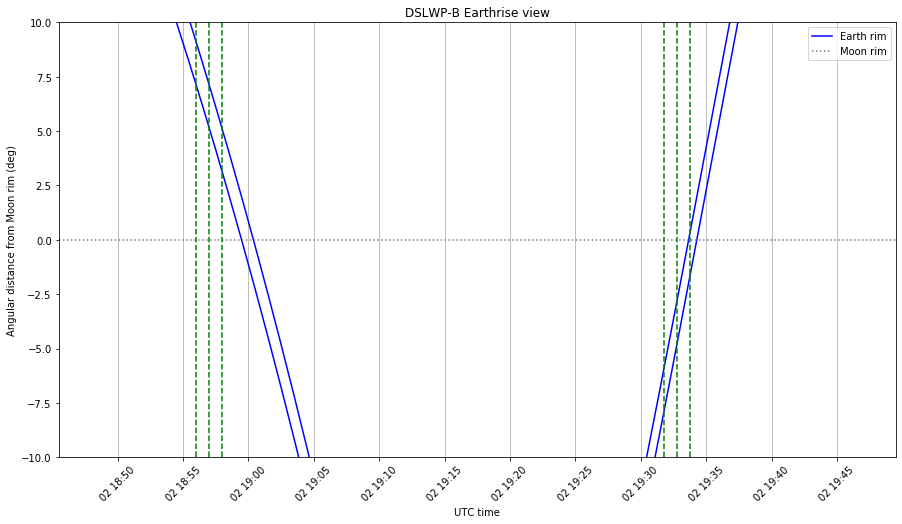
- 2019-07-02 19:31:45
- 2019-07-02 19:32:45
- 2019-07-02 19:33:45
The idea for July 2 is to take an image of the Earth and Moon just before the Earth becomes hidden behind the Moon and just after it reappears. Determining these moments accurately is difficult. The Moon will be moving rather fast across the field of view of the camera, since the orbit altitude is rather low. Therefore, the timing of these events is sensitive to the satellite ephemeris and the orbit propagation algorithm. To try to mitigate this effect, we will take a series of three images spaced one minute instead of taking a single image.
On June 30, the same imaging run is mimicked: a series of three images will be taken before the Moon hides the centre of the image (this time the Earth will not be present) and a series of three images will be taken after the centre of the image becomes unblocked again.
The figure below shows the camera view prediction for the June 30 imaging run. The calculations have been done with the 20190630 ephemeris from dslwp_dev.
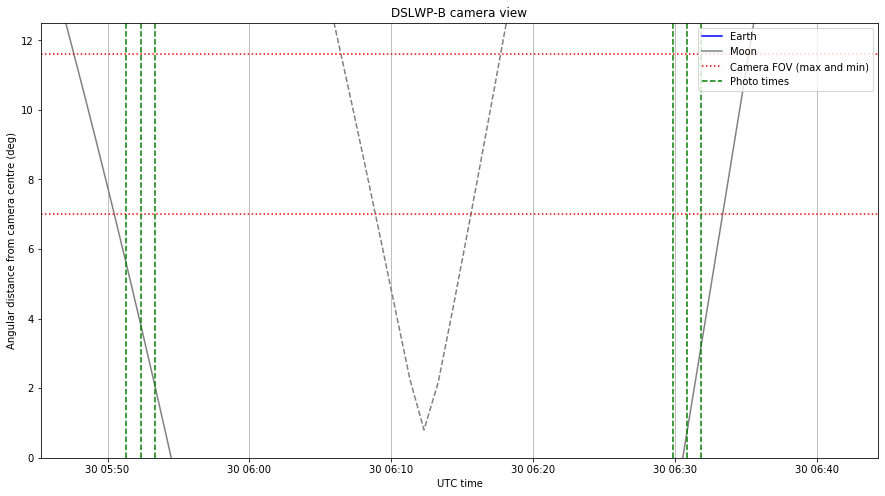
We note that the second run of three images seems a little early. Wei is doing his calculations with STK and apparently he is getting slightly different orbital predictions compared to my predictions done in GMAT. We haven’t tried to study these differences, but this gives an idea of how sensitive the imaging times are to ephemeris and orbital propagators. Hopefully the series of three images will account for orbital errors. Additionally, after doing the test run on June 30, the results can be compared with the orbital prediction and the imaging times for July 2 can be modified slightly if necessary.
The figure below shows the camera view for the July 2 eclipse imaging run. The 20190630 ephemeris have been used for this plot also. We have the same effect, where the second proposed imaging times seem somewhat early.
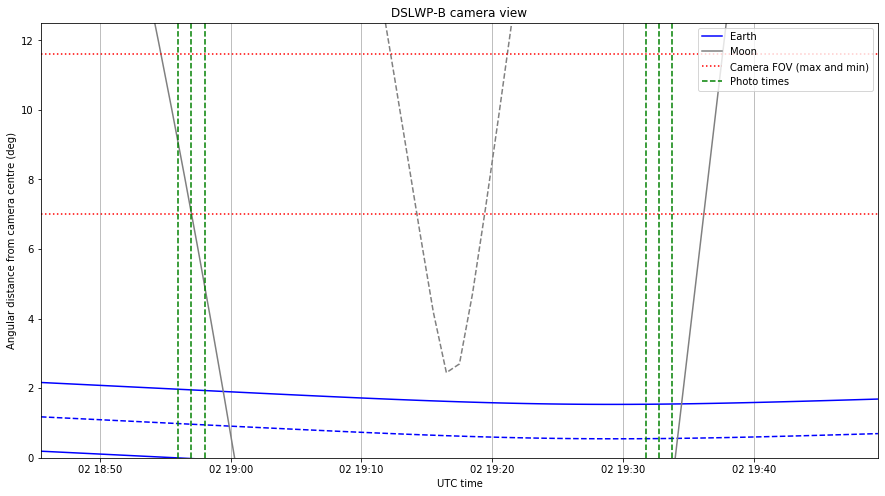
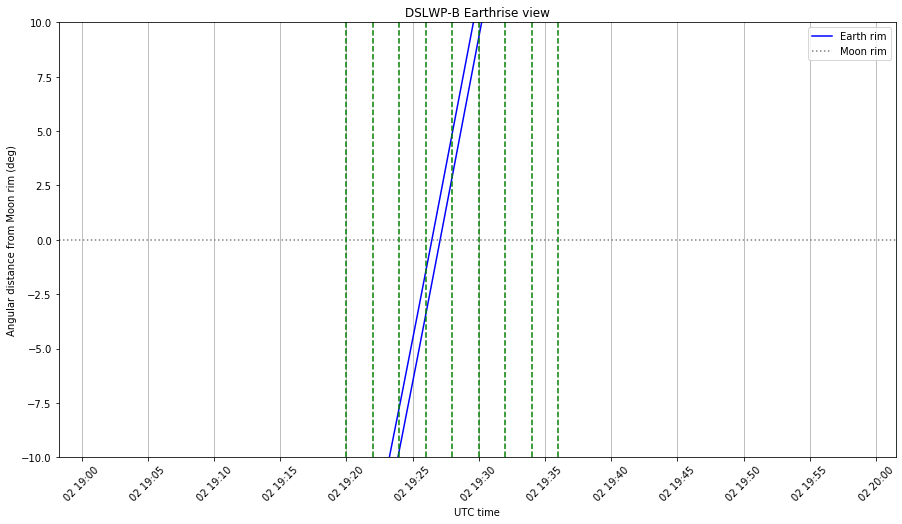
Since this time the Earth is also visible in the image, it is convenient to plot the “Earthrise view” plot, which I have used on other occasions. This shows the angular distance between the Earth and the Moon rim, so it can be used to determine if the the Earth is hidden by the Moon (negative distance) or not.
As we can see below, according to my GMAT prediction, the Earth will not be visible in the images around 19:30. It seems these should be taken a few minutes later. However, Wei has obtained different results with STK. In any case, these imaging times can be corrected based on the results obtained on June 30.
The plots in this post have been made in this Jupyter notebook.