This is a post I had announced since I first described Tianwen-1’s modulation. Since we have very high SNR recordings of the Tianwen-1 low rate rate telemetry signal made with the 20m dish in Bochum observatory, it is interesting to make detailed measurements of the modulation parameters. In fact, there is something curious about the way the modulation is implemented in the spacecraft’s transmitter. This analysis will show it clearly, but I will reserve the details for later in the post.
Here I will be using a recording that already appeared in a previous post. It was made on 2020-07-26 07:47:20 UTC in Bochum shortly after the switch to the high gain antenna, so the SNR is fantastic. The recording was done at 2.5Msps, and the spectrum can be seen below. The asymmetry (especially around +1MHz) might be due to the receive chain.
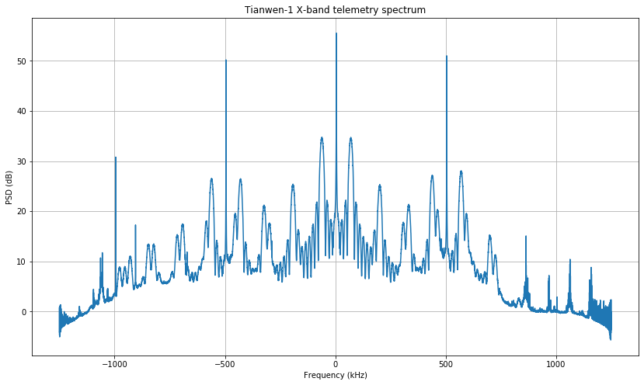
The signal is residual carrier phase modulation, with 16348 baud BPSK data on a 65536Hz square wave subcarrier. There is also a 500kHz ranging tone.