Galileo constellation outage

You may have already heard that the Galileo EU satellite navigation constellation is out of service since last Thursday July 11th. Currently the Galileo constellation status page shows that the status of most Galileo satellites is not usable because of a service outage. The satellites not affected by this outage are E20, which was made unavailable on 2014-05-27, and E14 and E18, the Galileo eccentric satellites, which failed to achieve the circular nominal orbit and are only used for testing purposes.

The European GNSS Agency has given very little information regarding the causes of the problem. The available information boils down to NAGU 2019026, posted on 2019-07-13 20:15, which states that starting from 2019-07-12 01:50 the Galileo signals should not be used.

This has originated many rumours and confusion about the problem. It seems that the major cause was a failure in the Precise Timing Facility, which is in charge of the generation of a realization of the GST, the timescale used by Galileo. This has affected the OSPF, which is the service that generates the orbit and clock products (ephemeris) for the satellites. Thus, since Thursday, no new ephemeris are being computed and uploaded to the satellites.

Taking rumours aside, in this post I will look at some facts about the outage which can be learned by analizing the Galileo signal. Other people have published similar studies, such as the NAVSAS group from University of Torino.

GPS SVN49 broadcasting non-standard codes again

As a GNSS engineer at my day job in GMV, it’s not uncommon to find myself looking at spectrums of the GNSS signal bands, either on a spectrum analyzer or on an IQ recording done by an SDR. A few days ago, I spotted something in the L1 band (1575.42MHz) that quickly caught my eye: a pair of strong carriers at +/- 511.5kHz away from the L1 centre frequency. This was visible on some of the recordings that we had done in the last few days, and also live on a spectrum analyzer.

When monitoring the signal on the spectrum analyzer, it disappeared a few hours later, making me suspect that it was transmitted by a satellite rather than a local interferer. Back at home, I did some recordings with STRF to try to identify the satellite using its Doppler.

The Doppler signature of the signal was a perfect match for GPS SVN49, also as USA-203 and GPS IIRM-7. This satellite, launched in 2009, was the first to demonstrate the L5 signal. During in-orbit testing, an anomaly with its navigation signals caused by the L5 filter was discovered. The satellite was never put into operational use, and has been used for varied tests ever since.

After searching information about this satellite, I learned that some researchers from Torino, Italy, had already observed back in 2017 the same kind of signals that I was seeing.

This post is a detailed study of the L1 signal that is currently being broadcast by GPS SVN49. The data used here has been published in Zenodo as “RF recordings of GPS SVN49 broadcasting non-standard codes“.

Antarctic expedition

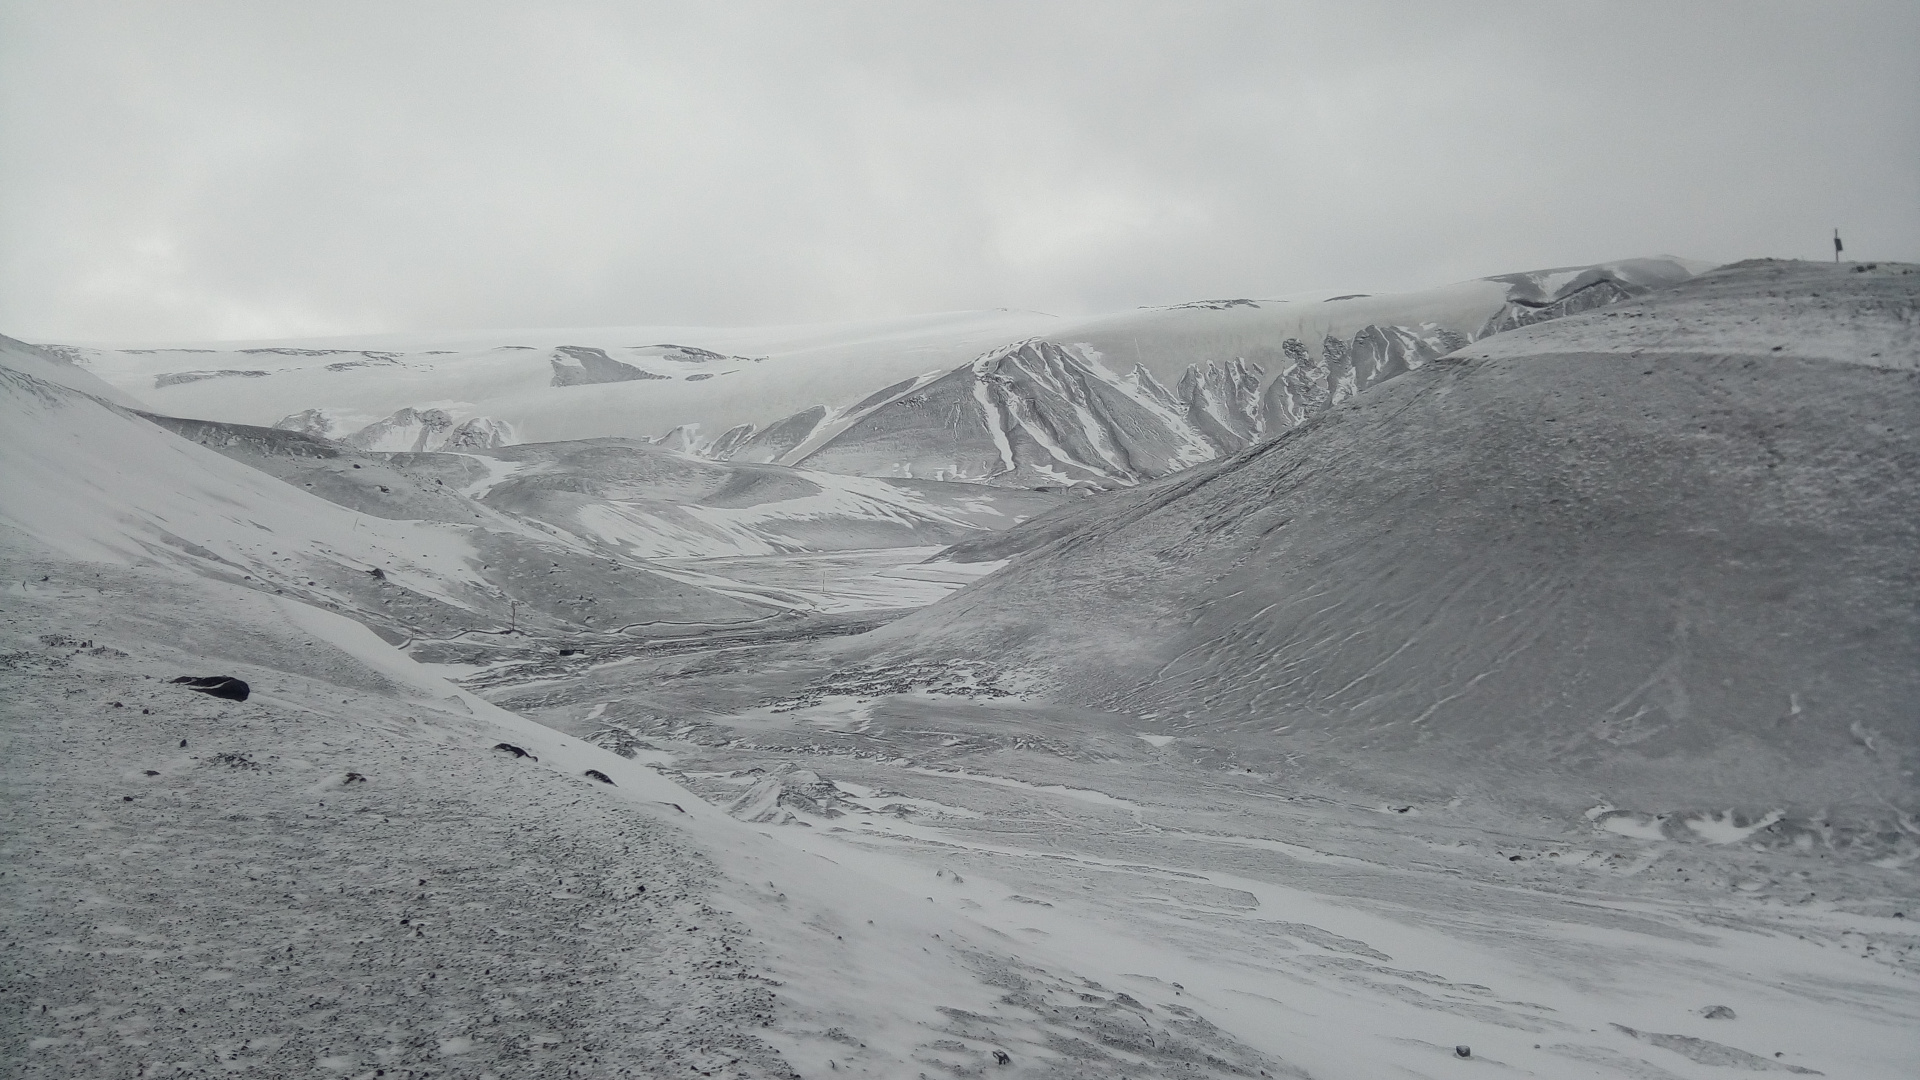
As you may know, between January 14 and February 18 I have been away from home on a research expedition to Antarctica. Several people have asked me for a post detailing my experiences, and I was also thinking to write at least something about the trip. I could spend pages talking about the amazing landscapes and fauna, or daily life in Antarctica. However, in keeping with the spirit of this blog, I will concentrate on the radio related aspects of the trip (and there are indeed enough to tell a story). If I see that there is much interest in other topics, I might be persuaded to run a Q&A post or something similar.

Apparently, my trip and my posts in Twitter raised the attention of a few Hungarian Amateurs, who even discussed and followed my adventures in their Google group. Thanks to Janos Tolgyesi HG5APZ for his interest and for some good discussion over email during my voyage.

Weird repair of the day: u-blox LEA-5S I2C interface

I have a DF9NP 10MHz GPSDO that is based on a u-blox LEA-5S GPS receiver. Essentially, the LEA-5S outputs an 800Hz signal that is used to discipline a 10MHz VCTCXO with a PLL. The LEA-5S doesn’t have persistent storage, so an I2C EEPROM is use to store the settings across reboots.

Lately it seemed that the reading of the settings from the EEPROM had failed. The u-blox was always booting with the default settings. This prevents the GPSDO from working, since the default for the timepulse signal is 1Hz instead of 800Hz. Here is the summary of my troubleshooting session and the weird repair that I did.

Improved signal processing for LilacSat-2 VLBI

Last week I published my results about the LilacSat-2 VLBI experiment. There, I mentioned that there were some things I still wanted to do, such as studying the biases in the calculations or trying to improve the signal processing. Since then, I have continued working on this and I have tried out some ideas I had. These have given good results. For instance, I have been able to reduce the delta-range measurement noise from around 700m to 300m. Here I present the improvements I have made. Reading the previous post before this one is highly recommended. The calculations of this post were performed in this Jupyter notebook.

Amateur VLBI experiment with LilacSat-2

On 23 February, Wei Mingchuan BG2BHC published on Twitter the first Amateur VLBI experiment. This consisted of a GPS-synchronized recording of signals from LilacSat-2 using USRPs in groundstations at Harbin and Chongqing, which are about 2500km apart. Wei has made a Github repository containing the recording (in MATLAB file format) and some signal processing in MATLAB. I have done some signal processing of my own with the recording and published my results in a Jupyter notebook. Here I describe some general aspects about VLBI and its use in Amateur radio, and some specific details of the signal processing I have done.

Studying IONEX files

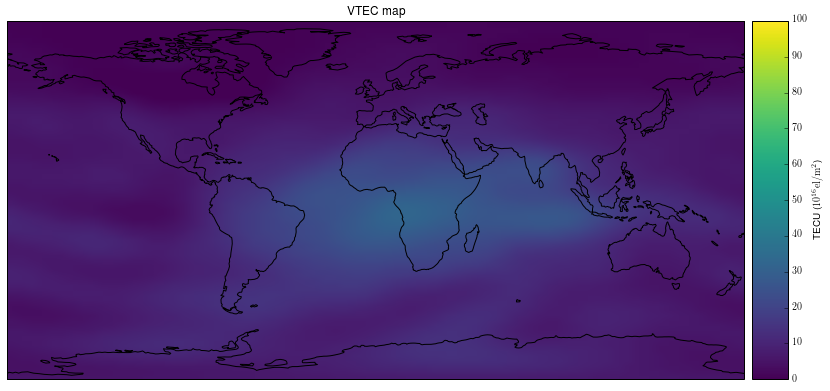
Many Amateur radio operators are familiar with the effects of the ionosphere at HF frequencies. However, the effects of the ionosphere are also noticeable at much higher frequencies. In particular, at L band, which is used by most satellite navigation systems. Thus, GNSS receivers can be used to measure ionospheric parameters. These measurements are usually distributed as TEC maps in IONEX files.

Here I describe some basic ionospheric physics, how a GNSS receiver can measure the ionosphere, and give some Python code to study TEC maps in IONEX files. Then I use TEC maps to study the CODAR ionospheric observations I did in December last year.