As a GNSS engineer at my day job in GMV, it’s not uncommon to find myself looking at spectrums of the GNSS signal bands, either on a spectrum analyzer or on an IQ recording done by an SDR. A few days ago, I spotted something in the L1 band (1575.42MHz) that quickly caught my eye: a pair of strong carriers at +/- 511.5kHz away from the L1 centre frequency. This was visible on some of the recordings that we had done in the last few days, and also live on a spectrum analyzer.
When monitoring the signal on the spectrum analyzer, it disappeared a few hours later, making me suspect that it was transmitted by a satellite rather than a local interferer. Back at home, I did some recordings with STRF to try to identify the satellite using its Doppler.
The Doppler signature of the signal was a perfect match for GPS SVN49, also as USA-203 and GPS IIRM-7. This satellite, launched in 2009, was the first to demonstrate the L5 signal. During in-orbit testing, an anomaly with its navigation signals caused by the L5 filter was discovered. The satellite was never put into operational use, and has been used for varied tests ever since.
After searching information about this satellite, I learned that some researchers from Torino, Italy, had already observed back in 2017 the same kind of signals that I was seeing.
This post is a detailed study of the L1 signal that is currently being broadcast by GPS SVN49. The data used here has been published in Zenodo as “RF recordings of GPS SVN49 broadcasting non-standard codes“.
My recording setup at home is a LimeSDR locked to an external 10MHz reference generated by a DF9NP GPSDO. The antenna is an inexpensive small patch for GPS L1 which has good visibility of the northern sky but limited visibility of the southern sky. The same antenna is used for recording with the LimeSDR and for the GPSDO.
I use STRF to compute and record waterfall data. See this tutorial for more information about STRF. The lime_gnss_iot.grc GNU Radio flowgraph is used to record IQ data at 2Msps to the FIFO /tmp/gnss_fifo, while rffft is run as
rffft -i /tmp/gnss_fifo -f 1575.42e6 -s 2e6 -c 10 -t 100 -F float
to record waterfall data.
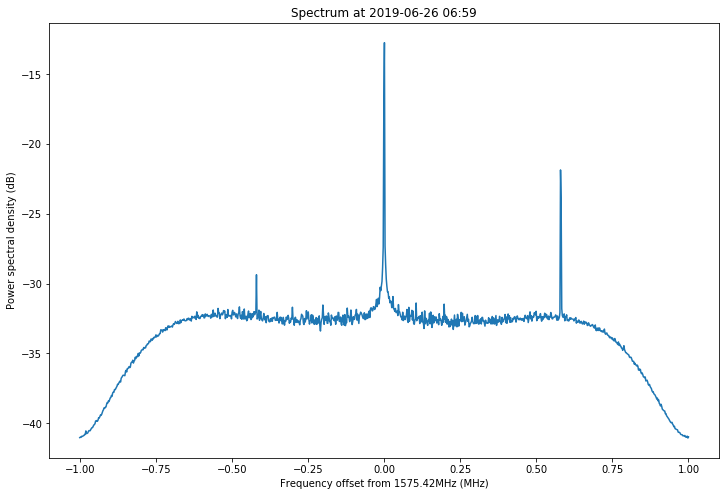
The signal of SVN49 is clearly visible in the two spectrums shown below, produced with this Jupyter notebook by reading the data recorded by rffft. The first shows the spectrum before SVN49 is visible in the sky. Three spikes are visible: one is the DC spike and the two others are local interferers.
The second figure shows the spectrum four hours later, after SVN49 has appeared in the sky. Besides the two local interferers that are also present above, spikes at +/- 511.5kHz have appeared. This is the signal broadcast by SVN49 and it is what caught my attention originally, since I had never seen such a signal in the L1 band.
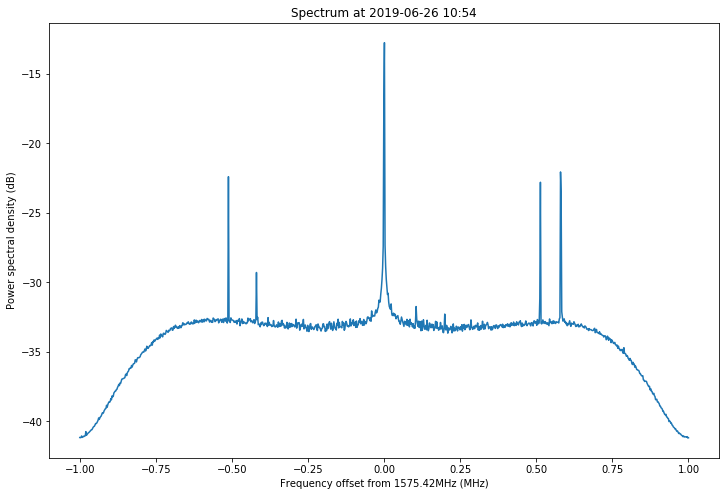
This signal is produced by using a so-called non-standard code. Instead of transmitting a spread spectrum PRN based on a Gold code, the satellite transmits a PRN which consists of alternating zeros and ones. This can be seen as a square wave subcarrier, which produces modulation sidebands at +/- 511.5kHz (half the chipping rate). Instead of spreading the signal power over 2MHz of bandwidth, as the spread spectrum PRNs do, the non-standard code concentrates the signal power in these two spikes.
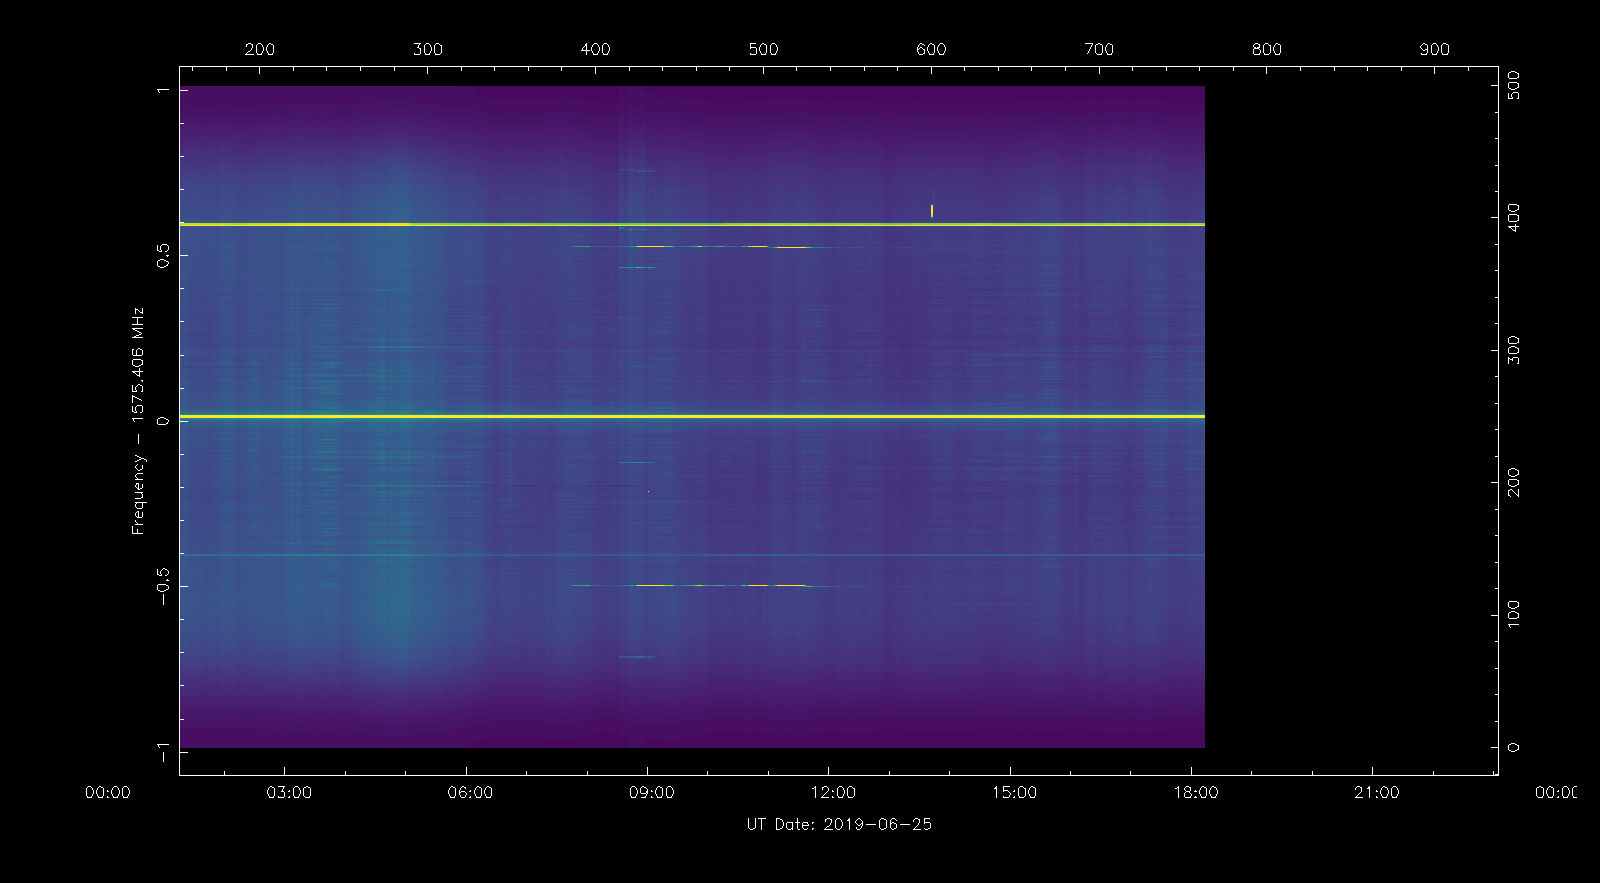
The figure below shows some waterfall data in rfplot. Approximately between 08:00 and 14:00 UTC the two spikes produced by SVN49 are visible.
Using
rfplot -p 2019-06-25T20\:59\:36 -f 1575.9315e6 -w 10e3 -z 0.01
we can view a waterfall of the upper sideband (the upper spike at 1575.9315MHz) of the modulation. The figure below shows the Doppler curve during one full pass of the satellite. The fainter traces are spectral lines from other GNSS satellites that are using spread spectrum codes.
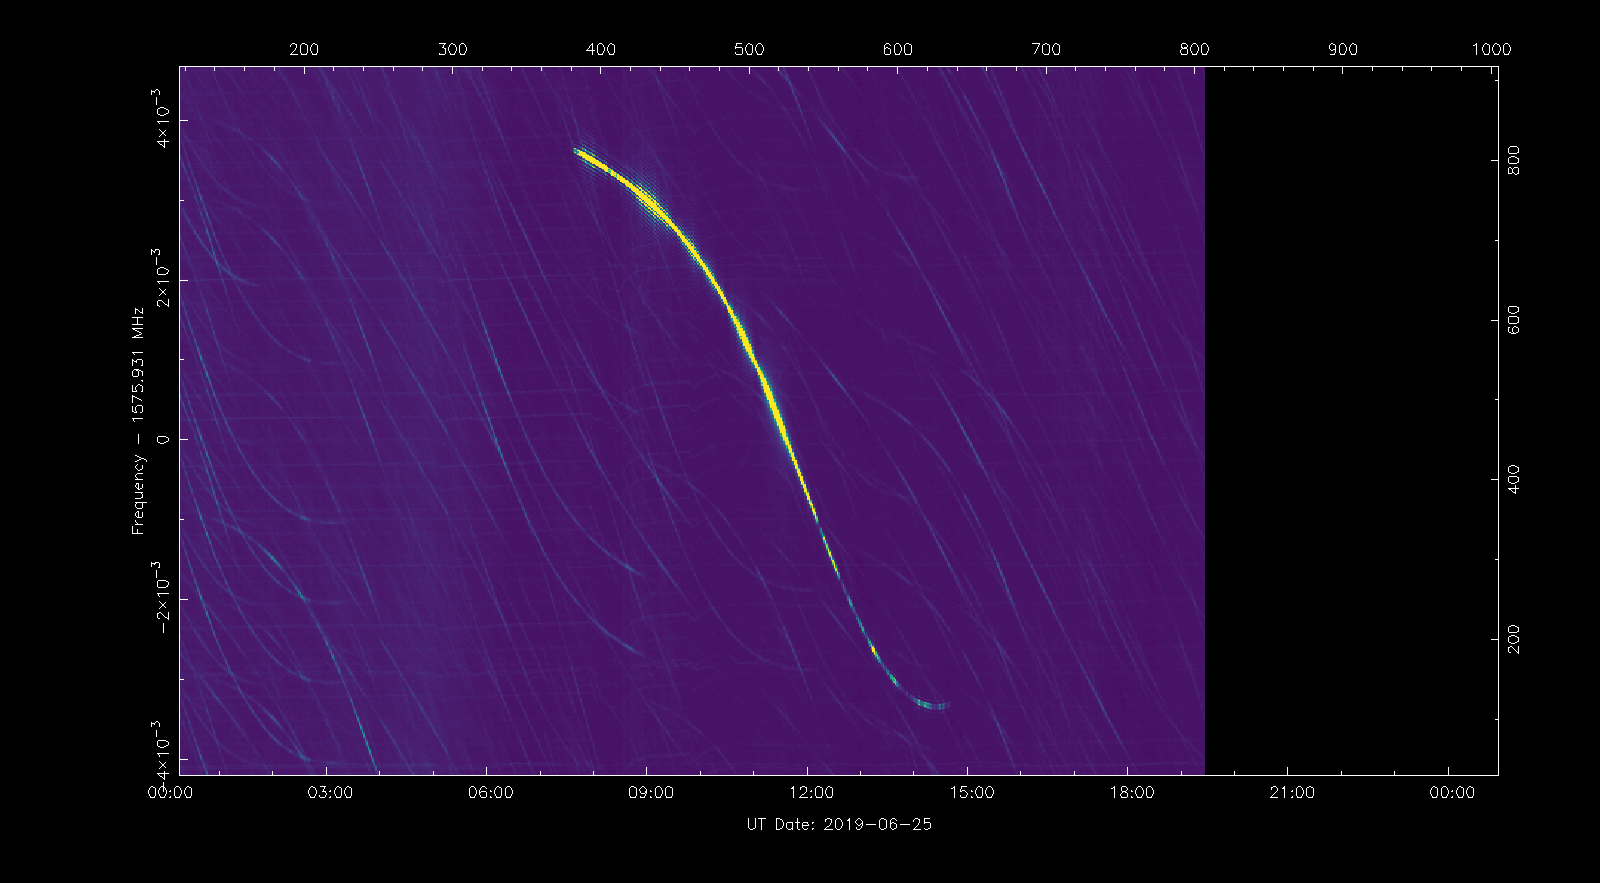
Doppler data can be extracted from the waterfall above and then processed with rffit to identify the TLE that best matches the Doppler curve (see exercise 6 in this tutorial). The latest TLEs from Space-Track were used.
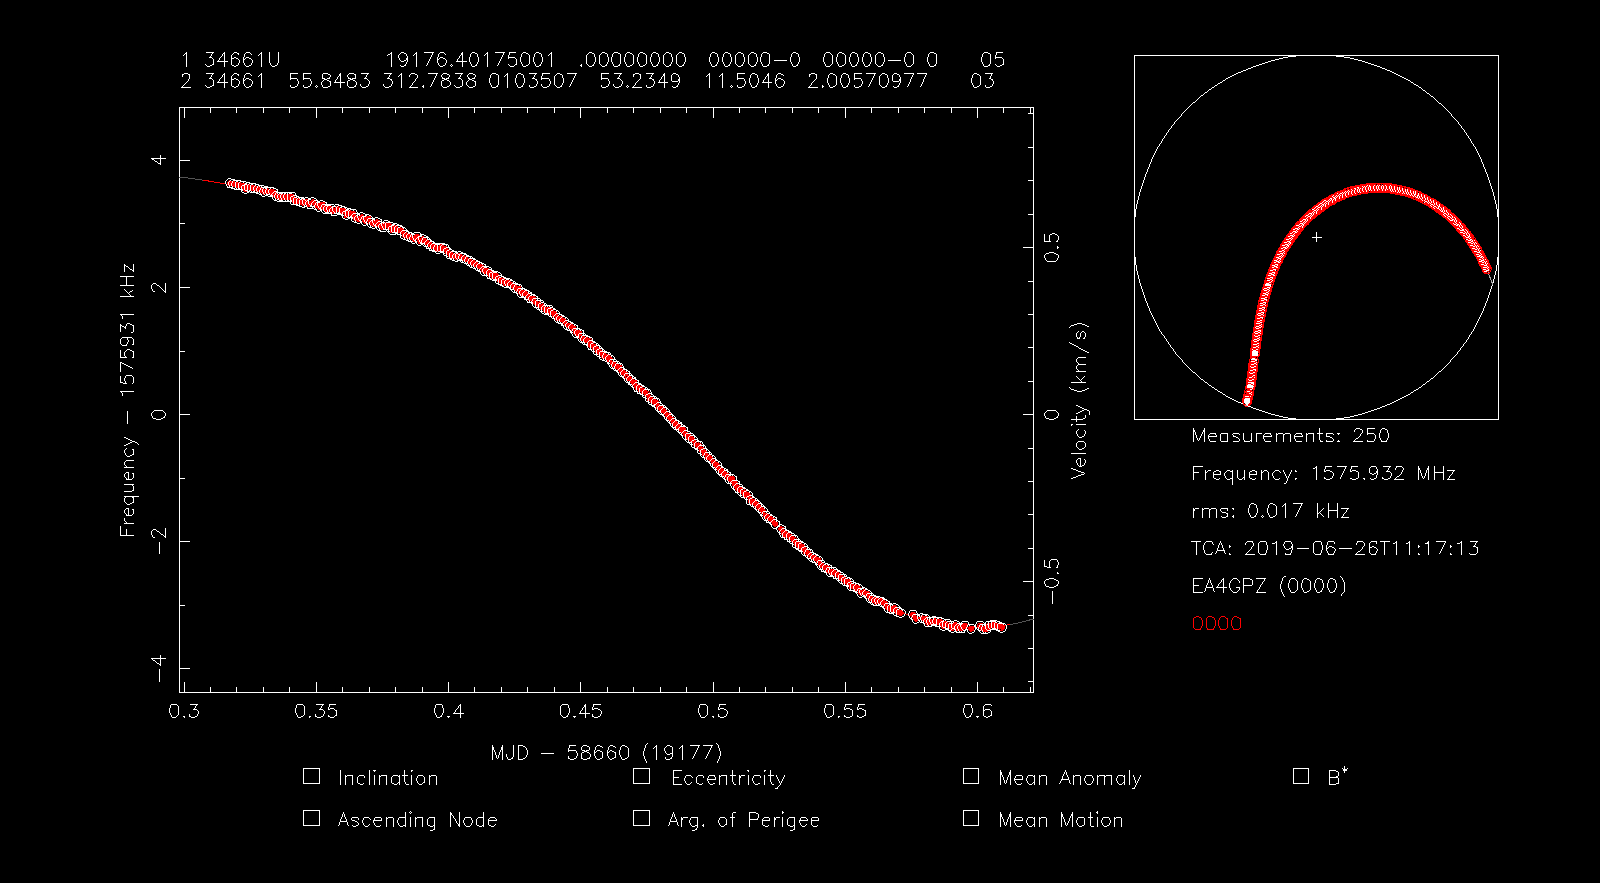
The TLE for NORAD ID 34661, which corresponds to SVN49, gives the smallest RMS error when fitting the Doppler curve. As shown in the figure, the error is 17Hz. No other satellites produced an error smaller than 100Hz, so the signal is determined to come from SVN49 without any possible doubt.
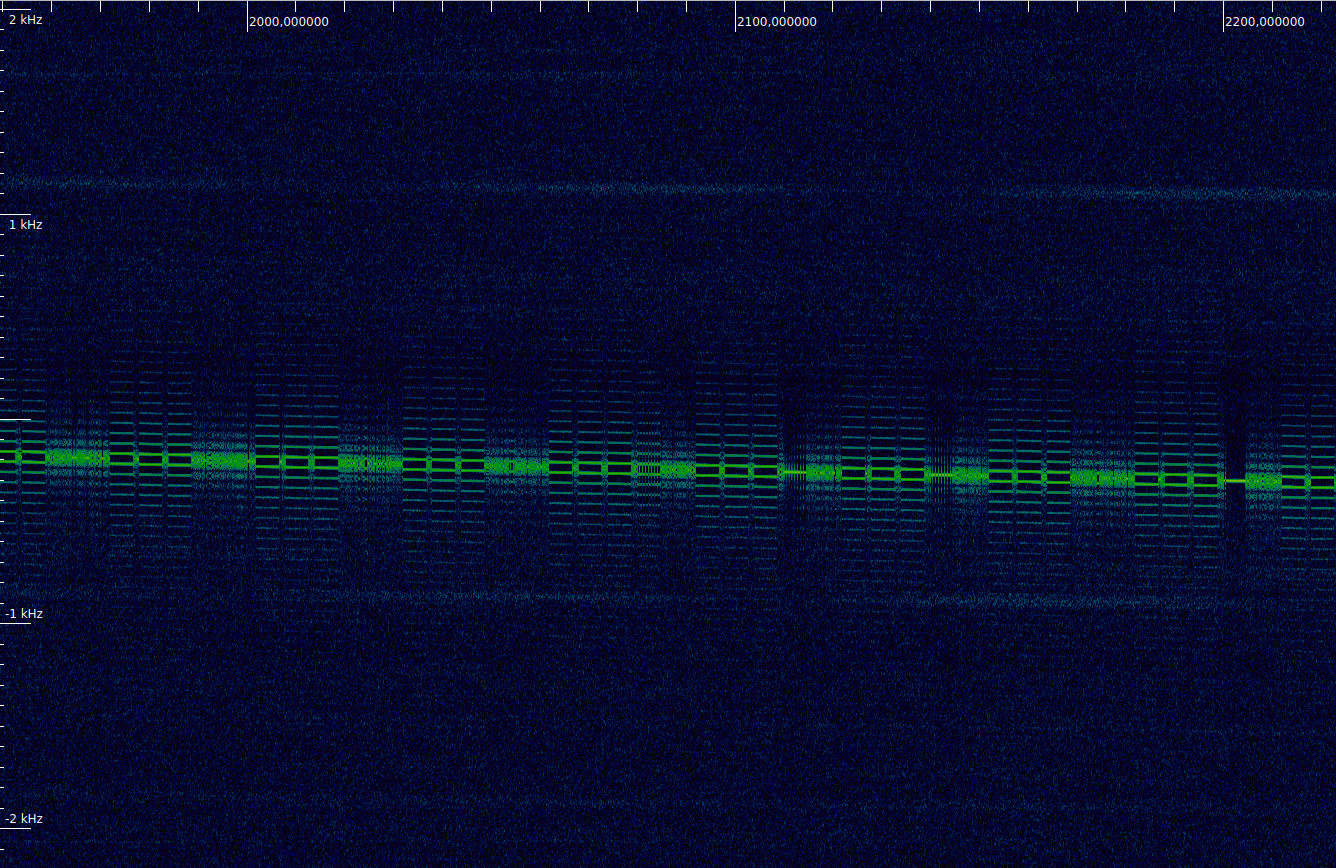
A more careful look at the signal shows that it is modulated with navigation data. Low rate (5ksps and 10ksps) IQ samples centred on 1575.9315MHz were recorded for later analysis of the modulation. The figure below shows a waterfall of the signal in inspectrum. A 50 baud BPSK modulation is clearly visible. There are other much fainter traces that correspond to spectral lines of other GNSS satellites using spread spectrum modulations. The data modulation is also visible in these.
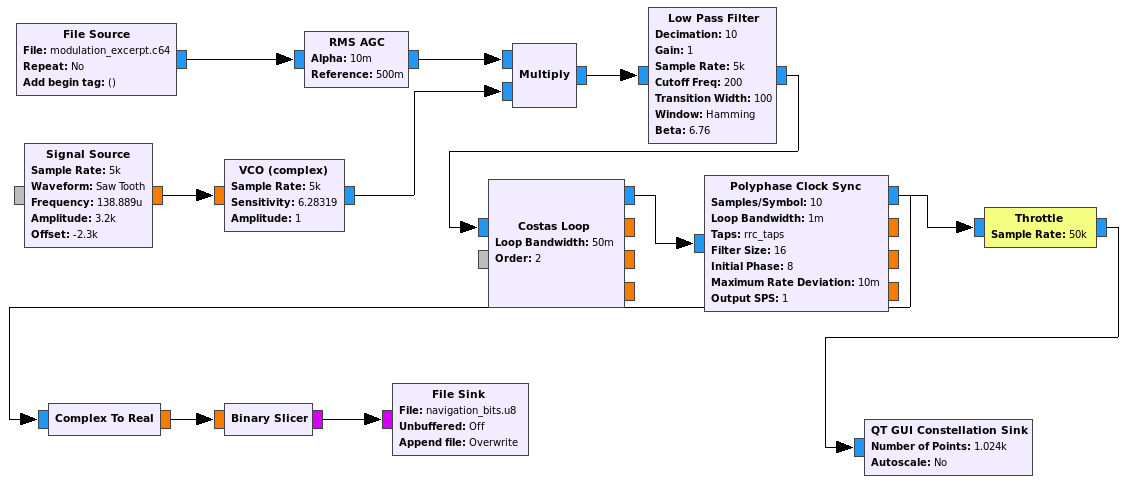
The bpsk_demod.grc GNU Radio flowgraph is used to demodulate a excerpt of this IQ recording. The flowgraph is shown below. A signal source and VCO blocks are used for coarse Doppler correction, assuming a constant frequency change rate with parameters estimated by eyeball. The BPSK symbols are saved to a file for later processing.
The excerpt processed by this flowgraph is a 3600 second long segment of the usb_modulation_2019-06-25T20:59:41.378538_5ksps.c64, starting at an offset of 49900 seconds. This corresponds to 2019-06-25 10:51:21 UTC. The excerpt is made with
dd if=usb_modulation_iq_2019-06-25T20\:59\:41.378538.c64 of=modulation_excerpt.c64 bs=1000000 count=144 skip=1996
The navigation message is then analyzed in this Jupyter notebook. We refer the reader to that notebook for the detailed analysis. Only a summary is included in this post.
Most of the navigation message data is valid. HOW words with TOWs ranging between 10:52:18 and 11:48:48 have been decoded with successful parity. The remaining data in the TLM and HOW words is valid, but, interestingly, the alert (which indicates a satellite malfunction) and anti-spoofing (which indicates that the P code is encrypted) flags are not set. Subframes 1 through 5 are transmitted in the usual cycle.
The 8 data words (i.e., the words other than the HOW and TOW) for subframes 1 (WN, health and clock), and 2 and 3 (ephemeris) are not valid. A sequence of alternating ones and zeros is transmitted in these words, including over the parity data. This makes the parity of these words invalid. It is interesting that in 2017 the researchers from Torino observed valid ephemeris data.
In contrast, subframes 4 and 5, which contain almanac and other data are valid and contain seemingly good and current almanac data for the complete GPS constellation.
In view of this information, it is interesting to come back to the waterfall of the signal shown above. The data is perfectly visible in the spectrum. Since the contents of subframes 1, 2 and 3 are alternating ones and zeros, these produce a line spectrum. Therefore, each of these subframes is perfectly visible in the waterfall. The contents of subframes 4 and 5 vary a lot depending on which page is transmitted. Therefore, we see different spectral patterns for these subframes, such as a line spectrum indicating periodic data (perhaps anti-spoofing and signal capabilities flags), a carrier indicating constant data (probably all zeros), and a more uniform spectrum indicating more complicated data.
Finally, it is interesting to address the question of when did SVN49 start broadcasting non-standard codes again and if anyone has noticed this before. According to the current IGS MGEX Satellite metadata file, SVN49 broadcasted PRN04 between 2016-02-02 and 2016-09-14 , between 2017-01-06 and 2017-05-13, and between 2017-12-01 and 2018-09-29. I have consulted the U.S. Coast Guard Navigation Center about this non-standard code and they state that SVN49 will transmit the non-standard code whenever it is not in use for other testing purposes.
Thus, shortly after it stopped broadcasting PRN04 in May 2017, the researchers from Torino noticed the presence of the non-standard code. Throughout most of 2018, SVN49 was again broadcasting PRN04, but presumably it was back to the non-standard code on October 2018.
I have searched online for reports of SVN49 transmitting the non-standard code, but I couldn’t find anything besides the article from Torino. Perhaps this is already well known and people do not bother to report it anymore. Still, it is interesting that I haven’t noticed the non-standard code until June 2019. There is perhaps a reason for this.
Currently, SVN49 is visible from Madrid between approximately 06:30 and 14:00 UTC. The orbital period of a GPS satellite is exactly half a sidereal day, so it always repeats the same ground track. However, each day the satellite passes 3 minutes and 56 seconds earlier, so the interval when the satellite is visible from one particular location keeps shifting throughout the year. Therefore, six months ago, SVN49 was visible between 18:30 and 02:00 UTC. Thus, during the summer is when the period where SVN49 is visible from Madrid best matches the normal working hours. So the fact that I have first noticed the non-standard code in June is not completely a mere coincidence.