A few weeks ago, a presentation by Octavian Andrei, of the Finnish Geospatial Research Institute, appeared in YouTube showing technical details about the Galileo constellation outage that happened between July 12 and 16. In the presentation, Octavian studies the navigation data gathered by a geodetic receiver in Metsähovi, showing anomalies in some of the parameters of the navigation message, such as the \(\text{IOD}_{\text{nav}}\), the SISA (signal in space accuracy) and the DVS (data validity status).
Back in July, I looked at the navigation data from the outage in this post, where I used navigation RINEX files collected by the IGS MGEX to study changes and anomalies in the navigation message. In that post I concentrated on July 16 and 17, to show what happened as the system was coming back online. Octavian has discovered some very interesting anomalies that happened before the incident, on July 10 and 11. Indeed, the first anomaly happened at 13:40 GST on July 10, well before July 11 21:50 GST, when the navigation message stopped being updated.
Thus, in view of Octavian’s discoveries, I have revisited my study, including also data from July 10 and 11, and paying special attention to the \(\text{IOD}_{\text{nav}}\) parameter, which can be seen to have the most interesting behaviour in Octavian’s presentation.
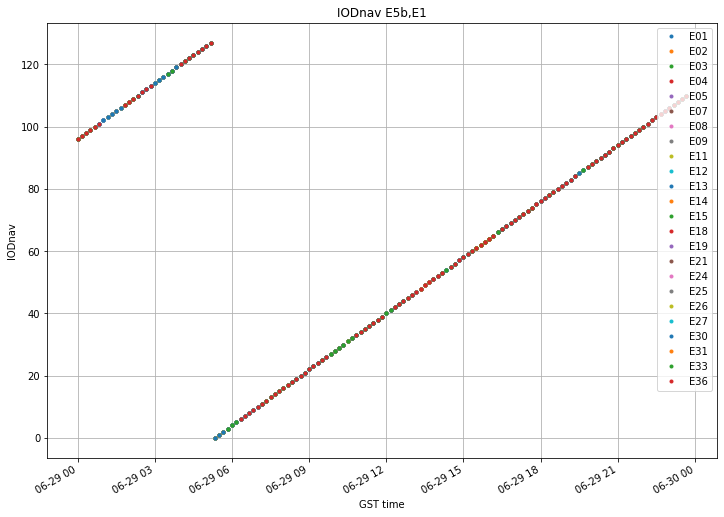
In my original study, I didn’t pay so much attention to the \(\text{IOD}_{\text{nav}}\) because it behaved rather normally on July 16 and 17. However, since it seems that it plays a key role in how the outage started, I have started by plotting the \(\text{IOD}_{\text{nav}}\) in a very similar manner as to how Octavian does. The figure below shows the evolution of the \(\text{IOD}_{\text{nav}}\) on June 29, which was used as a control day (i.e., a day without anomalies) for my study. We can see the behaviour that Octavian remarks: even thought the \(\text{IOD}_{\text{nav}}\) is a 10 bit number, it increases by one every ten minutes and rolls over after reaching 127.
The figure below shows the \(\text{IOD}_{\text{nav}}\) evolution on July 10 and 11, before the outage happened. All the anomalous details are best seen in Octavian’s video, but here I’ll summarise the most important.
- There is a gap where no updated ephemerides are transmitted shortly after the rollover on July 10.
- At the end of the gap, the \(\text{IOD}_{\text{nav}}\) jumps back up briefly.
- Then it continues updating as if nothing had happened.
- At some point, the ephemeris update rate changes from 10 minutes to 3 hours, and the \(\text{IOD}_{\text{nav}}\) increases a lot with each update.
- This continues until 21:50 GST on July 11, when the last batch is transmitted. Around 12:00 UTC on July 11, some of the satellites transmit batches out of the normal sequence, at an update rate faster than 3 hours.
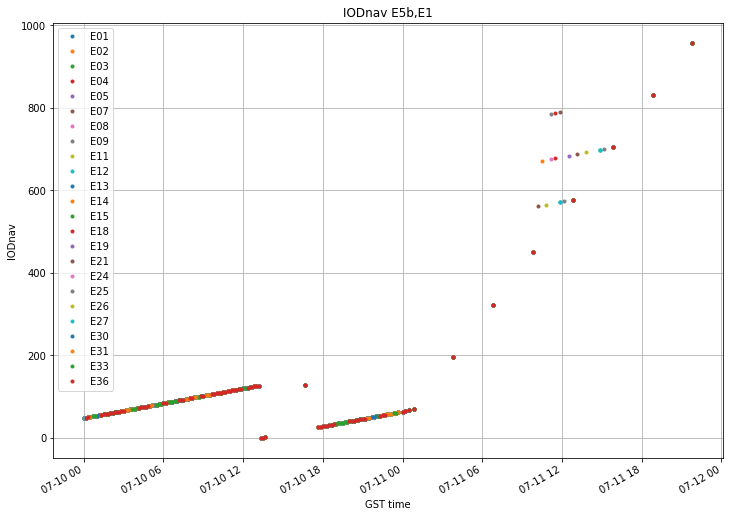
It is interesting to note that, should the increasing trend of the \(\text{IOD}_{\text{nav}}\) had continued at the same rate every 3 hours, the value would had overflown after 21:50 UTC. Maybe this is just a coincidence, but it might explain why the batch at 21:50 was the last one.
The satellites transmitting anomalous \(\text{IOD}_{\text{nav}}\)’s around 12:00 UTC will be studied in more detail below.
Finally, the figure below shows the evolution of the \(\text{IOD}_{\text{nav}}\) on July 16 and 17, as the system was coming back to normal. Everything looks OK except for a point which doesn’t belong to the normal evolution.
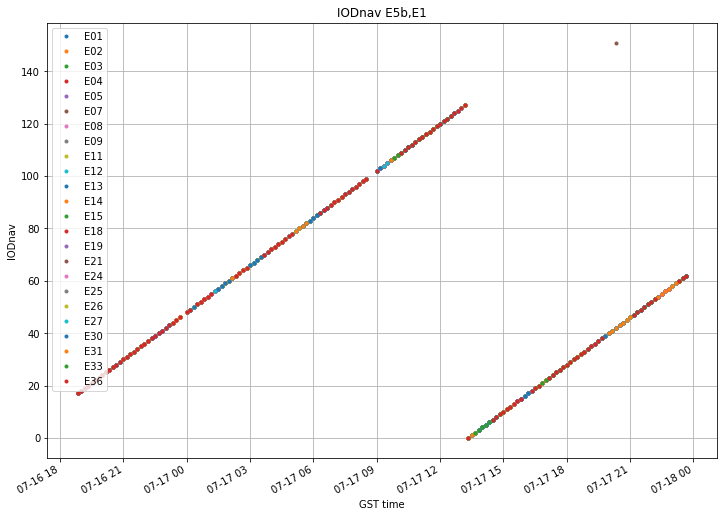
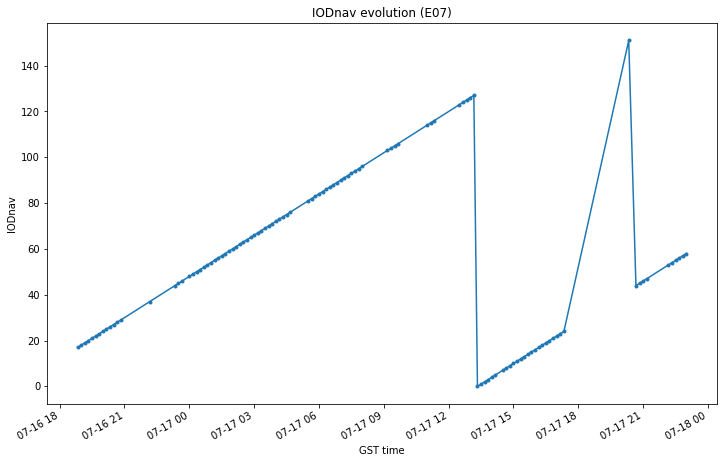
Closer inspection shows that that point correspond to SVN E07, which transmitted an \(\text{IOD}_{\text{nav}}\) of 157 at 20:20 GST on July 17. Below we see that this is the only anomaly. The evolution of the \(\text{IOD}_{\text{nav}}\) of E07 is completely normal if we ignore this unusual jump.
Now we turn our attention to the ephemeris availability during July 10 and 11. The plot, which was first introduced in my study, is show below.

There are two interesting things in this graph. The first is that E21 doesn’t update its navigation message through most of July 10. This is rather unusual and I think no one had noticed it before. The other interesting thing is that we are able to see the satellite that transmit a batch outside of the regular 3 hour pattern. These are E03, E04, E07, E09, E11, E12, E14, E18, E19, E21, E24, E25 and E27. We see that each of these satellites only transmits one or two batches outside of the 3 hour pattern. This is rather interesting, but the reasons for this behaviour are completely unknown to me.
Now we turn to the study of the SISA. Whereas in the previous studies only the values NAPA, 0 (probably a receiver bug) and 3.12m appeared, before the outage we also have the values 3.28m, 3.44m and 3.6m. These are shown in red, purple and brown, respectively. The SISA for the frequency pair E5a,E1 is shown below. The SISA for E5b,E1 behaves very similarly.
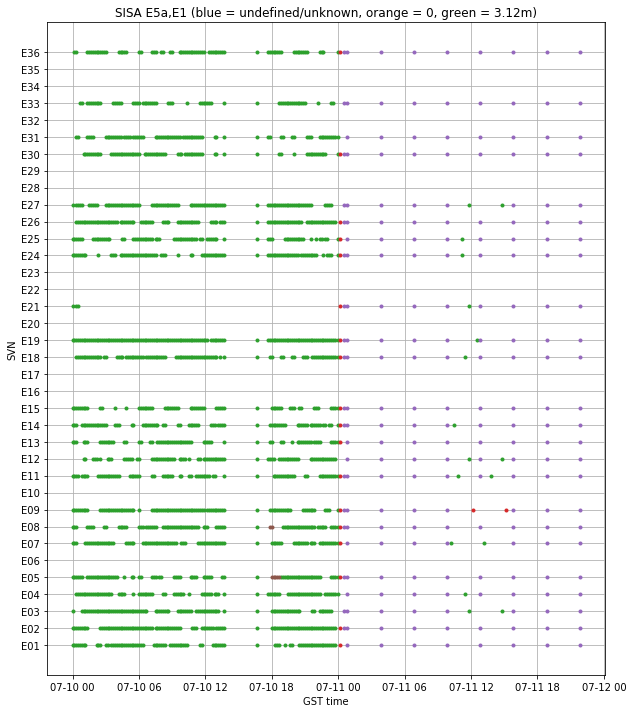
The first anomaly in the SISA happens at around 18:00 GST on July 10, when E05 and E08 broadcast 3.6m for a few batches. Then, at around 00:00 GST on July 11 we have all satellites transmitting 3.28m briefly. The 3 hour batches use a SISA of 3.44m. The satellites that break the 3 hour pattern transmit the usual SISA of 3.12m, except for E09, which transmits 3.28m.
The evolution of the DVS is shown below for the E5a signal. The other signals have a very similar behaviour.
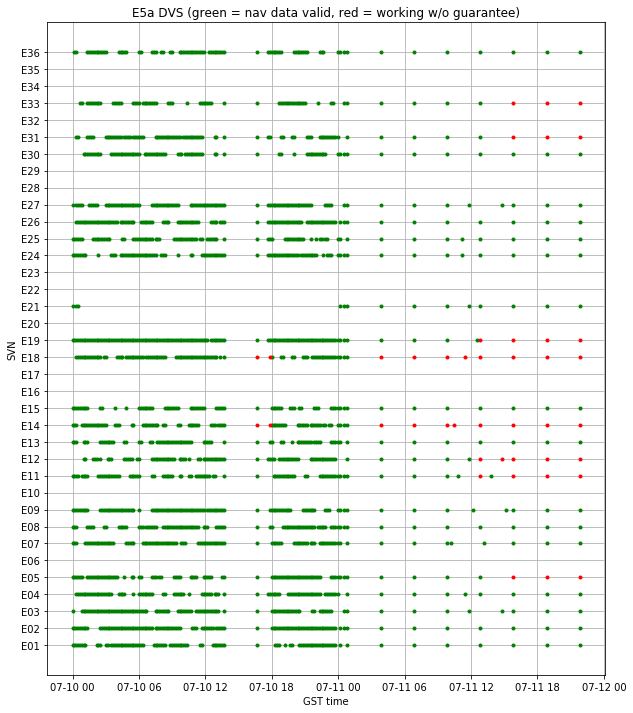
The first interesting thing is that satellites E14 and E18 broadcast working without guarantee briefly before 18:00 GST on July 10. These are the eccentric satellites. It seems that Octavian hasn’t consider them in his study. Since they transmit a health status of “in test”, it is possible that the receiver at Metsähovi doesn’t track them.
The second interesting thing is that, after the 3 hour pattern starts, some of the satellites switch to working without guarantee, but not at the same time. These are, the eccentric E14 and E18, which switch on immediately, E11, E12 and E19, which switch at the third batch, and E05, E31 and E33, that switch at the fourth batch.
Gossip is that some satellites have an updated software that detects when the onboard ephemeris expire and sets the DVS to working without guarantee automatically. Presumably, this kind of updates were first installed into the eccentric satellites, due to their unusual orbit. I don’t know how much of this story is true, but it is interesting to note the following: the eccentric satellites switch first, and then all the three IOV satellites E11, E12 and E19. However, there doesn’t seem to be any chronological relation between E05, E31 and E33.
The behaviour of the HS (health status) bits is not very interesting. As usual, the eccentric satellites broadcast “in test”, while the remaining satellites broadcast “OK”.
In summary, this post shows that all the anomalies observed by Octavian can also be seen in the IGS BRDC files. Also, there are some interesting aspects that I haven’t seen that anyone had noticed before:
- E07 transmitting a spurious \(\text{IOD}_{\text{nav}}\) on 2019-07-17 20:20 GST.
- E21 not updating its message during most of 2019-07-10.
- The relation between the SISA and the batches that break the 3 hour pattern.
- The groups of satellites that switched the DVS when the 3 hour pattern started: first the eccentrics, then the IOVs, then E05, E31 and E33.
The plots shown in this post have been made in this Jupyter notebook.