GRCon22 Capture The Flag

I have spent a great week attending GRCon22 remotely. Besides trying to follow all the talks as usual, I have been participating in the Capture The Flag. I had sent a few challenges for the CTF, and I wanted to have some fun and see what challenges other people had sent. I ended up in 3rd position. In this post I’ll give a walkthrough of the challenges I submitted, and of my solution to some of the other challenges. The material I am presenting here is now in the grcon22-ctf Github repository.

Writing GUPPI files with GNU Radio and using SETI tools

GUPPI stands for Green Bank Ultimate Pulsar Processing Instrument. The GUPPI raw file format, which was originally used by this instrument for pulsar observations, is now used in many telescopes for radio astronomy and SETI. For instance Breakthrough Listen uses the GUPPI format as part of the processing pipeline, as described in this paper. The Breakthrough Listen blimpy tools work with GUPPI files or with filterbank files (basically, waterfalls) that have been produced from a GUPPI file using rawspec.

I think that GNU Radio can be a very useful tool for SETI and radio astronomy, as evidenced by the partnership of GNU Radio and SETI Institute. However, the set of tools used in the GNU Radio ecosystem (and by the wider SDR community) and the tools used traditionally by the SETI community are quite different, and even the file formats and some key concepts are unalike. Therefore, interfacing these tools is not trivial.

During this summer I have been teaching some GNU Radio lessons to the BSRC REU students. As part of these sessions, I made gr-guppi, a GNU Radio out-of-tree module that can write GUPPI files. I thought this could be potentially useful to the students, and it might be a first step in increasing the compatibility between GNU Radio and the SETI tools. (The materials for the sessions of this year are in this repository, and the materials for 2021 are here; these may be useful to someone even without the context of the workshop-like sessions for which they were created).

In this post I will show how gr-guppi works and what are the key concepts for GUPPI files, as these files store the output of a polyphase filterbank, which many people from the GNU Radio community might not be very familiar with. The goal of the post is to generate a simulated technosignature in GNU Radio (a CW carrier drifting in frequency) and then detect it using turboSETI, which is a tool for detecting narrowband signals with a Doppler drift.

Before going on, it is convenient to mention that an alternative to this approach is using gr-turboseti, which wraps up turboSETI as a GNU Radio block. This was Yiwei Chai‘s REU project at the ATA in 2021.

Real time Doppler correction with GNU Radio

Satellite RF signals are shifted in frequency proportionally to the line-of-sight velocity between the satellite and groundstation, due to the Doppler effect. The Doppler frequency depends on time, on the location of the groundstation, and on the orbit of the satellite, as well as on the carrier frequency. In satellite communications, it is common to correct for the Doppler present in the downlink signals before processing them. It is also common to correct for the uplink Doppler before transmitting an uplink signal, so that the satellite receiver sees a constant frequency.

For Earth satellites, these kinds of corrections can be done in GNU Radio using the gr-gpredict-doppler out-of-tree module and Gpredict (see this old post). In this method, Gpredict calculates the current Doppler frequency and sends it to gr-gpredict-doppler, which updates a variable in the GNU Radio flowgraph that controls the Doppler correction (for instance by changing the frequency of a Frequency Xlating FIR Filter or Signal Source).

I’m more interested in non Earth orbiting satellites, for which Gpredict, which uses TLEs, doesn’t work. I want to perform Doppler correction using data from NASA HORIZONS or computed with GMAT. To do this, I have added a new Doppler Correction C++ block to gr-satellites. This block reads a text file that lists Doppler frequency versus time, and uses that to perform the Doppler correction. In this post, I describe how the block works.

LTE downlink: PBCH and PDCCH

This post is a continuation of my series about LTE signal analysis. In the previous post I showed how to decode the PHICH. Now we will decode two other downlink channels, the PBCH (physical broadcast channel) and the PDDCH (physical downlink control channel).

The PBCH is used to transmit the MIB (master information block). This is a small data packet that all the UEs must decode after detecting a cell using the synchronization signals. The MIB contains essential information for the usage of the cell, such as the cell bandwidth and PHICH configuration. The PDDCH contains control information, such as uplink grants and the scheduling of the PDSCH (physical downlink shared channel).

The PBCH and PDDCH use the same kind of channel coding: a tail-biting k=7, r=1/3 convolutional code with a circular buffer for rate matching that performs puncturing and repetition coding as needed to obtain the required codeword size. The remaining aspects of the PBCH and PDDCH are quite different, so they will be treated separately.

As usual, we will be using a short IQ recording from my local cell site. The link to the recording is given at the end of the post.

LTE downlink: PHICH

This is a continuation of my series of posts about LTE. In the previous post we looked at the downlink cell-specific reference signals (CRS), transmit diversity equalization, and the demodulation of the PBCH (physical broadcast channel), PCFICH (physical control format indicator channel) and PDSCH (physical downlink shared channel). In this post we will look at the PHICH (physical hybrid ARQ indicator channel). As usual, I will be analysing the recording of a base station that I did in the first post about the LTE downlink.

The PHICH is used to send hybrid-ARQ ACK/NACKs to the UEs. Each PHICH transmission carries a single bit, either ACK (encoded by the bit 1) or NACK (encoded by the bit 0). Repetition encoding is used to increase the chances of correct decoding, and an orthogonal overlay code allows transmitting information for several UEs using the same resource elements.

The PHICH is transmitted in the control region of the subframe, which is formed by the first 1, 2, or 3 symbols of the subframe (according to the CFI value). As other control channels, the PHICH uses REGs. Recall that a REG is a set of 4 resource elements which are not used for the transmission of the CRS and which are adjacent in frequency if we ignore the resource elements used for the CRS. For instance, when 2 or 4 antenna ports are used for the CRS, in the first symbol of the subframe two resource elements in every block of 6 are used for the CRS. The other 4 resource elements form a REG. Therefore, there are 2 REGs per resource block. In symbols 2 and 3 there may not be resource elements allocated to the CRS, so there are 3 REGs per resource block in that case.

A PHICH transmission uses 3 REGs which are equally spaced over the bandwidth of the cell, in order to give frequency diversity. This is similar to the PCFICH, which uses 4 equally spaced REGs in the first symbol of the subframe. Depending on the configuration of a parameter called PHICH duration, the PHICH can either use the first symbol in each subframe (normal PHICH duration), or the first 2 or 3 symbols in each subframe (extended PHICH duration). Here we will only look at the normal PHICH duration, which is what is used in the recording. In the normal duration, the 3 REGs are transmitted simultaneously in the first symbol of the subframe. In the extended duration the 3 REGs are distributed over the first 2 or 3 symbols of the subframe.

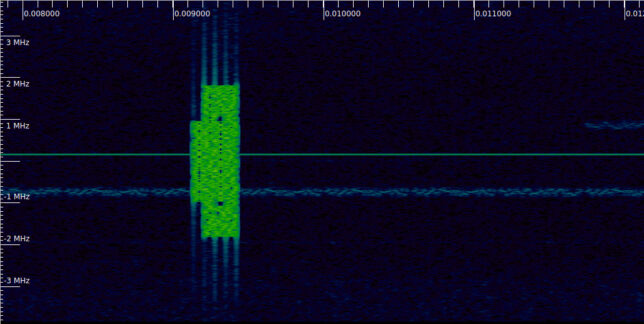
In the waterfall below we can see a PHICH transmission. In the first symbol of each subframe we can see the 4 REGs used by the PCFICH (the lower frequency REG, at around -4 MHz is barely visible). In the subframe near the centre of the image (which incidentally contains the synchronization signals), in addition to these 4 REGs, there are 3 more REGs in use, which I have marked with red ticks. These form a PHICH transmission.

Waterfall of an LTE downlink signal, showing PHICH transmissions

LTE downlink: reference signals and transmit diversity

In this post I continue with the analysis of an LTE downlink recording, which I started by looking at the primary and secondary synchronization signals. This recording is a one second excerpt of a 10 MHz cell in the B20 band that I recorded close to the base station, with a line-of-sight channel.

Now we will handle the reference signals to perform channel estimation. This will be used to equalize the received data transmissions. We will also handle the transmit diversity used by the base station, and show how to locate and demodulate some of the physical channels. All the calculations and plots are done in a Jupyter notebook.

The cell-specific reference signals (CRS) are transmitted in every subframe across all the cell bandwidth. They can be transmitted on either one, two or four antenna ports. In LTE, the concept of an antenna port does not necessarily correspond to a physical antenna. Signals are said to use the same antenna port if they have the same propagation channel to the user. Therefore, different beamforming combinations of the same physical antennas constitute different antenna ports.

The figure below shows the resource elements that are used for the reference signals in each of the ports. The resource elements allocated to reference signals for the antenna ports that are active are only used for this purpose, and only one of the ports transmits the reference signal in each of these resource elements. For instance, say that the cell uses two antenna ports. Then the elements marked as \(R_0\) and \(R_1\) below will only be used for the CRS, while the elements marked as \(R_2\) and \(R_3\) are free and can be used for other purposes.

Allocation of resource elements to CRS (taken from the LTE-Advanced book by Sassan Ahmadi)

To the pattern shown above, a frequency offset that consists of the PCI (physical cell ID) modulo 6 subcarriers is applied. This is done so that the reference signals of cells having different PCIs use different subcarriers, so as to prevent interference (especially those cells in the same group, since their PCI modulo 3 is different).

In the waterfall of our recording, we can clearly see the CRS transmissions. They last one symbol and occupy the whole bandwidth of the cell. We can also see the PSS, SSS and PBCH, as we remarked in the previous post. These indicate us where the subframes start. Thus, we can see that the first and fifth symbol of each slot are used for transmission of the CRS. This means that the cell does not use four antenna ports, since their corresponding CRS would be transmitted on the second symbol of each slot.

Waterfall of the downlink recording, showing CRS, PSS, SSS and PBCH

LTE downlink: synchronization signals

I have been posting about analysing LTE signals, with a focus on the structure of the pilot signals. I my two previous posts on this topic, I looked at the uplink using an IQ recording of my phone. Now I turn my attention to the downlink. I have done a short recording of the B20 band carrier of my local base station and I will be analysing it in this and future posts.

In this post, we will look at the primary synchronization signal (PSS) and secondary synchronization signal (SSS). These are the first signals in the downlink that a UE (phone) will attempt to detect and measure to estimate the carrier frequency offset, symbol time offset, start of the radio frames, cell identity, etc.

In an FDD system such as the one we are looking at here, the PSS is transmitted in the last symbol of slots 0 and 10 in each radio frame (Recall that LTE FDD signals are organized in 0.5 ms slots each containing 7 OFDM symbols. A radio frame lasts 10 ms and contains 20 slots). The SSS is transmitted on the symbol before the PSS.

The figure below shows the waterfall of the first 20 ms of the recording. I have marked the locations of the PSS and SSS with a red tick. These signals only occupy the 6 central resource blocks (1.08 MHz), so that they are compatible with all the possible cell bandwidths (LTE supports cell bandwidths of 1.4, 3, 5, 10, 15 and 20 MHz) and can be received by a UE which doesn’t know the cell bandwidth yet. In this case, we are looking at a 10 MHz cell, and we can see the neighbouring 10 MHz cells in the top and bottom of the waterfall.

Waterfall of LTE downlink carrier. Synchronization signals are marked with a red line.

We can see that every other PSS and SSS transmission there is another 1.08 MHz transmission following it. This corresponds to the PBCH (physical broadcast channel), which is transmitted on the first 4 symbols of slot 1 in each radio frame. The keen reader will have noticed that the PBCH is slightly wider than the PSS and SSS. This is because the PSS and SSS only use the central 62 out of 72 subcarriers in the 6 resource blocks they occupy, leaving 5 subcarriers at each edge as a guardband. This helps UEs having a large carrier frequency offset to detect these signals. On the other hand, the PBCH occupies all the 72 subcarriers.

Demodulation of LTE PUCCH

In a previous post I showed how to demodulate the LTE physical uplink shared channel (PUSCH) by using a recording of my phone and some Python code. This is a continuation of that post. Here we will look at the physical uplink control channel (PUCCH) transmissions in that recording, and use a similar approach to demodulate them. All the work is done in a Jupyter notebook, which is linked at the end of the post.

The PUCCH carries control information from the UE to the eNodeB, such as scheduling requests, ACK/NACK for HARQ, and the CQI (channel quality indicator). A PUCCH transmission lasts for one subframe (1 ms) and typically occupies a single 12-subcarrier resource block in each of the two 0.5 ms slots in the subframe (there are more recently introduced PUCCH formats which use more subcarriers).

PUCCH transmissions are allocated to the edges of the uplink bandwidth, so as to leave the centre clear as a contiguous segment to be used for PUSCH. On its first slot, the PUCCH transmission uses some particular resource block. On its second slot it uses the symmetric resource block with respect to the centre frequency. This gives some frequency diversity to the transmissions.

The figure below shows a portion of the waterfall of the LTE uplink recording that we will be using (the link to the recording is included in the previous post). It corresponds to a 10MHz-wide cell in the B20 band. The PUCCH transmissions are the narrow bursts. The wider stronger bursts are PUSCH.

Waterfall of an LTE uplink showing some PUCCH and PUSCH transmissions

This illustrates that the PUCCH subframes are allocated to the edges of the cell, and how each subframe jumps to the symmetric resource block on its second slot.

Demodulation of the LTE uplink

I have been playing with some LTE recordings to brush up my knowledge, since it isn’t a protocol I’m very familiar with. I’m specially interested in understanding the structure and properties of all the pilot signals. Textbooks and documentation are great, but nothing beats getting your hands dirty with some IQ recordings to be sure you understand all the details.

To have something to work with, I have done some recordings of my phone by holding it near a USRP B205mini without an antenna. While recording, I was playing a Youtube video or browsing the web, to have some traffic. A waterfall of one of the recordings can be seen below. In this post we will be looking at how to demodulate the highlighted section, which contains 7 ms of PUSCH (physical uplink shared channel) occupying 15 resource blocks, together with the corresponding DMRS (demodulation reference signal) symbols. The post assumes some familiarity with OFDM, but doesn’t require any previous knowledge of LTE, so it can be useful to people interested in a hands-on introduction to LTE.

Waterfall of LTE uplink signal (using inspectrum)

More data from Voyager 1

Back in September, I showed how to decode the telemetry signal from Voyager 1 using a recording made with the Green Bank Telescope in 2015 by the Breakthrough Listen project. The recording was only 22.57 seconds long, so it didn’t even contain a complete telemetry frame. To study the contents of the telemetry, more data would be needed. Often we can learn things about the structure of the telemetry frames by comparing several consecutive frames. Fields whose contents don’t change, counters, and other features become apparent.

Some time after writing that post, Steve Croft, from BSRC, pointed me to another set of recordings of Voyager 1 from 16 July 2020 (MJD 59046.8). They were also made by Breakthrough Listen with the Green Bank Telescope, but they are longer. This post is an analysis of this set of recordings.