A very quick RFI survey at the Allen Telescope Array

At the beginning of August I visited the Allen Telescope Array (ATA) for the Breakthrough Listen REU program field trip (I have been collaborating with the REU program for the past few years). One of the things I did during my visit was to use an ADALM Pluto running Maia SDR to do a very quick scan of the radio frequency interference (RFI) on-site. This was not intended as a proper study of any sort (for that we already have the Hat Creek Radio Observatory National Dynamic Radio Zone project), but rather as a spoor-of-the-moment proof of concept.

The idea was to use equipment I had in my backpack (the Pluto, a small antenna, my phone and a USB cable), step just outside the main office, scroll quickly through the spectrum from 70 MHz to 6 GHz, stop when I saw any signals (hopefully not too many, since Hat Creek Radio Observatory is supposed to be a relatively quiet radio location), and make a SigMF recording of each of the signals I found. It took me about 15 minutes to do this, and I made 6 recordings in the process. A considerable amount of time was spent downloading the recordings to my phone, which takes about one minute per recording (since recordings are stored on the Pluto DDR, only one recording can be stored on the Pluto at a time, and it must be downloaded to the phone before making a new recording).

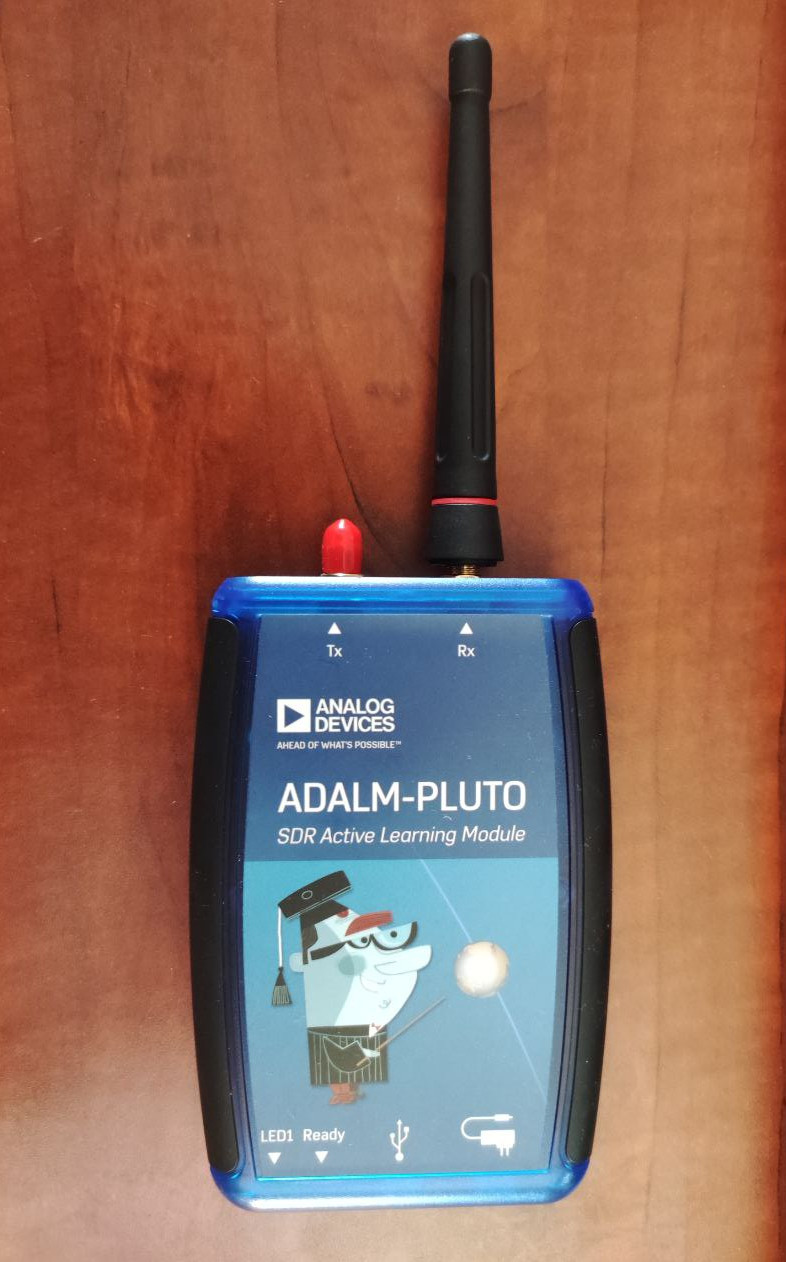
This shows that Maia SDR can be a very effective tool to get a quick idea of how the local RF environment looks like, and also to hunt for local RFI in the field, since it is quite easy to carry around a Pluto and a phone. The antenna I used was far from ideal: a short monopole for ~450 MHz, shown in the picture below. This does a fine job at receiving strong signals regardless of frequency, but its sensitivity is probably very poor outside of its intended frequency range.

ADALM Pluto and 450 MHz antenna

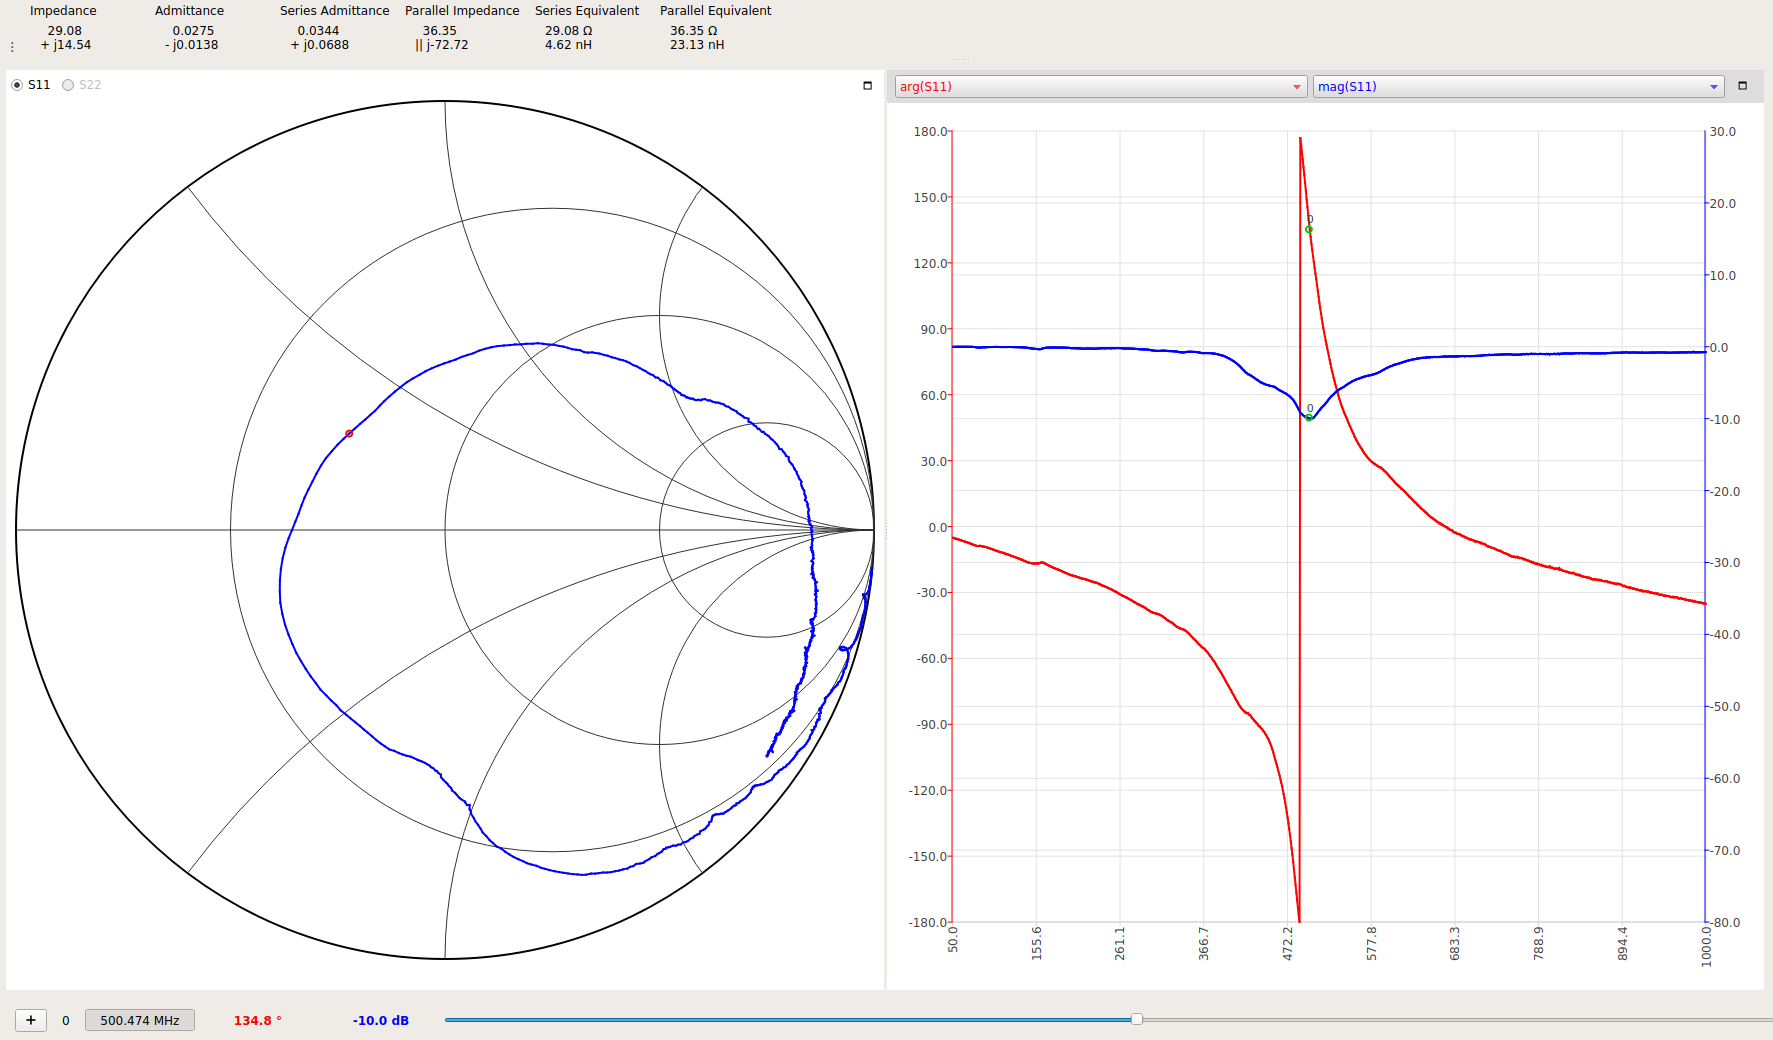
The following plot shows the impedance of the antenna measured with a NanoVNA V2. The impedance changes noticeably if I put my hand on the NanoVNA, with the resonant peak shifting down in frequency by 50 to 100 MHz. Therefore, this measurement should be taken just as a rough ballpark of how the antenna looks like on the Pluto, which I was holding with my hand.

Impedance of the 450 MHz antenna

As the antenna I used for this survey is pretty bad, the scan will only show signals that are actually very strong on the ATA dishes. The log-periodic feeds on the ATA dishes tend to pick up signals that do not bounce off the dish reflectors, and instead arrive to the feed directly from a side. This is different from a waveguide type feed, in which signals need to enter through the waveguide opening. Therefore, besides having the main lobe corresponding to a 6.1 m reflector, the dishes also have relatively strong sidelobes in many directions, with a gain roughly comparable to an omnidirectional antenna. The system noise temperature of the dishes is around 100 to 150 K (including atmospheric noise and spillover), while the noise figure of the Pluto is probably around 5 dB. This all means that the dishes are more sensitive to detect signals from any direction that the set up I was using. In fact, signals from GNSS satellites from all directions can easily be seen with the dishes several dB above the noise floor, but not with this antenna and the Pluto.

Additionally, the scan only shows signals that are present all or most of the time, or that I just happened to come across by chance. This quick survey hasn’t turned up any new RFI signals. All the signals I found are signals we already knew about and have previously encountered with the dishes. Still, it gives a good indication of what are the strongest sources of RFI on-site. Something else to keep in mind is that the frequency range of the Allen Telescope Array is usually taken as 1 – 12 GHz. Although the feeds probably work with some reduced performance somewhat below 1 GHz, observations are done above 1 GHz. Therefore, none of the signals I have detected below 1 GHz are particularly important for the telescope observations, since they are not strong enough to cause out-of-band interference.

I have published the SigMF recordings in the Zenodo dataset Quick RFI Survey at the Allen Telescope Array. All the recordings have a sample rate of 61.44 Msps, since this is what I was using to view the largest possible amount of spectrum at the same time, and a duration of 2.274 seconds, which is what fits in 400 MiB of the Pluto DDR when recording at 61.44 Msps 12 bit IQ (this is the maximum recording size for Maia SDR). The published files are as produced by Maia SDR. At some point it could be interesting to add additional metadata and annotations.

In the following, I do a quick description of each of the 6 recordings I made.

Decoding Euclid

Euclid is an ESA near-infrared space telescope that was launched to the Sun-Earth Lagrange L2 point on July 1, using a Falcon 9 from Cape Canaveral. The spacecraft uses K-band to transmit science data, and X-band with a downlink frequency of 8455 MHz for TT&C. On July 2 at 07:00 UTC, 16 hours after launch and with the spacecraft at a distance of 167000 km from Earth, I recorded the X-band telemetry signal using antennas 1a and 1f from the Allen Telescope Array. The recording lasted approximately 4 hours and 30 minutes, until the spacecraft set.

Even though the telemetry signal fits in about 300 kHz, I recorded at 4.096 Msps, since I wanted to see if there were ranging signals at some point. Since the IQ recordings for two antennas at 4.096 Msps 16-bit are quite large, I have done some data reduction before publishing to Zenodo. I have decided to publish only the data for antenna 1a, since the SNR in a single antenna is already very good, so there is no point in using the data for the second antenna unless someone wants to do interferometry. Since looking in the waterfall I saw no signals outside of the central 2 MHz, I decimated to 2.048 Msps 8-bit. Also, I synthesized the signal polarization from the two linear polarizations. To fit within Zenodo’s constraints for a 50 GB dataset, I split the recording in two parts of 32 GiB each.

The recording is published in these two datasets:

In this post I will look at the signal modulation and coding and present GNU Radio decoders. I will look at the contents of the telemetry frames in a future post.

Decoding JUICE

JUICE, the Jupiter Icy Moons Explorer, is ESA’s first mission to Jupiter. It will arrive to Jupiter in 2031, and study Ganymede, Callisto and Europa until 2035. The spacecraft was launched on an Ariane 5 from Kourou on April 14. On April 15, between 05:30 and 08:30 UTC, I recorded JUICE’s X-band telemetry signal at 8436 MHz using two of the 6.1 m dishes from the Allen Telescope Array. The spacecraft was at a distance between 227000 and 261000 km.

The recording I made used 16-bit IQ at 6.144 Msps. Since there are 4 channels (2 antennas and 2 linear polarizations), the total data size is huge (966 GiB). To publish the data to Zenodo, I have combined the two linear polarizations of each antenna to form the spacecraft’s circular polarization, and downsampled to 8-bit IQ at 2.048 Msps. This reduces the data for each antenna to 41 GiB. The sample rate is still enough to contain the main lobes of the telemetry modulation. As we will see below, some ranging signals are too wide for this sample rate, so perhaps I’ll also publish some shorter excerpts at the higher sample rate.

The downsampled IQ recordings are in the following Zenodo datasets:

In this post I will look at the signal modulation and coding, and some of its radiometric properties. I’ll show how to decode the telemetry frames with GNU Radio. The analysis of the decoded telemetry frames will be done in a future post.

Decoding ArgoMoon

ArgoMoon is one of the ten cubesats that were launched in the Artemis I mission. It was built by the Italian private company Argotec, and its main mission was to image the ICPS after the separation of Orion, and while the other cubesats were deployed.

In 2022-11-16, about seven hours after launch, I used two antennas from the Allen Telescope Array to record telemetry from the Orion vehicle and some of the cubesats. Since then, I have been posting regularly as I analyze these recordings and publish the data to Zenodo. In this post I will look at two recordings of the X-band telemetry signal of ArgoMoon at 8475 MHz. In the two recordings, different modulation and data rate is used.

The recordings are available in the dataset Recording of Artemis I ArgoMoon with the Allen Telescope Array on 2022-11-16 in Zenodo.

Decoding EQUULEUS

Here is a new post in my Artemis I series. EQUULEUS (called EQUL by the DSN) is one of the ten cubesats launched in the Artemis I mission. It is a 6U spacecraft developed by JAXA and University of Tokio. Its mission is to study the Earth’s plasmasphere and to demonstrate low-thrust trajectories in the Earth-Moon region using its water thrusters. The spacecraft communications are supported mainly by the Japanese Usuada Deep Space Center, but JPL’s Deep Space Network also collaborates.

I did an observation of the Orion vehicle and some of the cubesats with two antennas from the Allen Telescope Array some seven hours after launch. As part of this observation, I made a 10 minute recording of the X-band telemetry signal of EQUULEUS as it was in communications with the DSN station at Goldstone. I have published the recording in the Zenodo dataset Recording of Artemis I EQUULEUS with the Allen Telescope Array on 2022-11-16. In this post, I analyze the recording.

Decoding LunaH-Map

This post is a continuation of my Artemis I series. LunaH-Map, also called Lunar Polar Hydrogen Mapper (and called HMAP by the DSN) is one of the ten cubesats that were launched with Artemis I. It is operated by Arizona State University, and its main mission was to use a scintillation neutron detector to investigate the presence of hydrogen-rich compounds such as water around the lunar south pole. Unfortunately, it was unable to perform its required lunar orbit insertion burn. Nevertheless, the spacecraft seems to be functioning well and some technology demonstrations and tests are being done with its subsystems. With some luck, there might be opportunities for this satellite to move to lunar orbit in the future.

In my observation with the Allen Telescope Array done about seven hours after the Artemis I launch I did some recordings of the LunaH-Map X-band telemetry signal when it was in communications with the DSN grounstation at Goldstone. First I did a 10 minute recording at 15:00 UTC. Then I noticed that the spacecraft had changed its modulation, so I did a second recording at 15:16 UTC, which lasted ~7 minutes. Unfortunately, I didn’t record the moment in which the telemetry change happened.

I have published these two recordings in the dataset Recordings of Artemis I LunaH-Map with the Allen Telescope Array on 2022-11-16 in Zenodo. This post is an analysis of the signals in these recordings.

Artemis I Orion recordings published

In my previous post, I described the observations I had made with the Allen Telescope Array of the Orion vehicle and some of the cubesats of the Artemis I mission following the launch. I showed how to decode the 2 Mbaud OQPSK S-band telemetry signal from Orion using GNU Radio and aff3ct for LDPC decoding. In the post I indicated that I wanted to publish all these recordings in Zenodo, but since I had recorded a large amount of IQ data, I first needed to review the recordings and see what to publish and how to reduce the data.

I have now reviewed the recordings of the Orion 2216.5 MHz signal, and published them in the following datasets:

Additionally, I have published the decoded AOS Space Data Link telemetry frames in the dataset Decoded Artemis I Orion S-band telemetry frames recieved with the Allen Telescope Array on 2022-11-16.

Decoding the Artemis I Orion vehicle

On Wednesday 16th, the Artemis I mission was launched from Kennedy Space Center. This mission is the first (uncrewed) flight of the Orion Multi-Purpuse Crew Vehicle that will be used to return humans to the Moon in the next few years. Together with Orion, ten cubesats with missions to the Moon and beyond were also launched.

Seven hours after launch, I used two spare antennas from the Allen Telescope Array to record RF signals from Orion and some of the cubesats. By that time, the spacecraft were at a distance of 72000 km, increasing to 100000 km during the 3 hours that the observations lasted.

I have collected a lot of data on those observations, around 1.7 TB of IQ recordings. I am going to classify and reduce this data, with the goal of publishing it on Zenodo. Given the large amount of data, this will take some time. I will keep posting in this blog updates on this progress, as well as my results of the analysis of these signals.

Today’s post is about Orion’s S-band main telemetry signal, which is transmitted at 2216.5 MHz. This signal has attracted great interest in the spacecraft tracking community because back in August NASA published an RFI giving the opportunity to ground stations belonging to private companies, research institutions, amateur associations and private individuals to track the S-band signal and provide Doppler data to NASA. Some of the usual contributors of the amateur space tracking community, including Dwingeloo’s CAMRAS (see their results webpage), Scott Chapman K4KDR and Scott Tilley VE7TIL (see his Github repository) are participating in this project.

Shortly after Artemis I launched, Amateur observers in Europe, such as Paul Marsh M0EYT, the Dwingeloo 25m radiotelescope, Ferruccio Andrea IW1DTU, Roland Proesch DF3LZ, were the first to receive the signals. They were then followed by those in America.

Radiometry for DELFI-PQ, EASAT-2 and HADES

On January 13, the SpaceX Transporter-3 mission launched many small satellites into a 540 km sun-synchronous orbit. Among these satellites were DELFI-PQ, a 3U PocketQube from TU Delft (Netherlands), which will serve for education and research, and EASAT-2 and HADES, two 1.5U PocketQubes from AMSAT-EA (Spain), which have FM repeaters for amateur radio. The three satellites were deployed close together with an Albapod deployer from Alba orbital.

While DELFI-PQ worked well, neither AMSAT-EA nor other amateur operators were able to receive signals from EASAT-2 or HADES during the first days after launch. Because of this, I decided to help AMSAT-EA and use some antennas from the Allen Telescope Array over the weekend to observe these satellites and try to find more information about their health status. I conducted an observation on Saturday 15 and another on Sunday 16, both during daytime passes. Fortunately, I was able to detect EASAT-2 and HADES in both observations. AMSAT-EA could decode some telemetry from EASAT-2 using the recordings of these observations, although the signals from HADES were too weak to be decoded. After my ATA observations, some amateur operators having sensitive stations have reported receiving weak signals from EASAT-2.

AMSAT-EA suspects that the antennas of their satellites haven’t been able to deploy, and this is what causes the signals to be much weaker than expected. However, it is not trivial to see what is exactly the status of the antennas and whether this is the only failure that has happened to the RF transmitter.

Readers are probably familiar with the concept of telemetry, which involves sensing several parameters on board the spacecraft and sending this data with a digital RF signal. A related concept is radiometry, where the physical properties of the RF signal, such as its power, frequency (including Doppler) and polarization, are directly used to measure parameters of the spacecraft. Here I will perform a radiometric analysis of the recordings I did with the ATA.

Decoding James Webb Space Telescope

The James Webb Space Telescope probably needs no introduction, since it is perhaps the most important and well-known mission of the last years. It was launched on Christmas day from Kourou, French Guiana, into a direct transfer orbit to the Sun-Earth L2 Lagrange point. JWST uses S-band at 2270.5 MHz to transmit telemetry. The science data will be transmitted in K-band at 25.9 GHz, with a rate of up to 28 Mbps.

After launch, the first groundstation to pick the S-band signal from JWST was the 10 m antenna from the Italian Space Agency in Malindi, Kenya. This groundstation commanded the telemetry rate to increase from 1 kbps to 4 kbps. After this, the spacecraft’s footprint continued moving to the east, and it was tracked for a few hours by the DSN in Canberra. One of the things that Canberra did was to increase the telemetry rate to 40 kbps, which apparently is the maximum to be used in the mission.

As JWST moved away from Earth, its footprint started moving west. After Canberra, the spacecraft was tracked by Madrid. Edgar Kaiser DF2MZ, Iban Cardona EB3FRN and other amateur observers in Europe received the S-band telemetry signal. When Iban started receiving the signal, it was again using 4 kbps, but some time after, Madrid switched it to 40 kbps.

At 00:50 UTC on December 26, the spacecraft made its first correction burn, which lasted an impressive 65 minutes. Edgar caught this manoeuvre in the Doppler track.

Later on, between 7:30 and 11:30 UTC, I have been receiving the signal with one of the 6.1 metre dishes at Allen Telescope Array. The telemetry rate was 40 kbps and the spacecraft was presumably in lock with Goldstone, though it didn’t appear in DSN now. I will publish the recording in Zenodo as usual, but since the files are rather large I will probably reduce the sample rate, so publishing the files will take some time.

In the rest of this post I give a description of the telemetry of JWST and do a first look at the telemetry data.