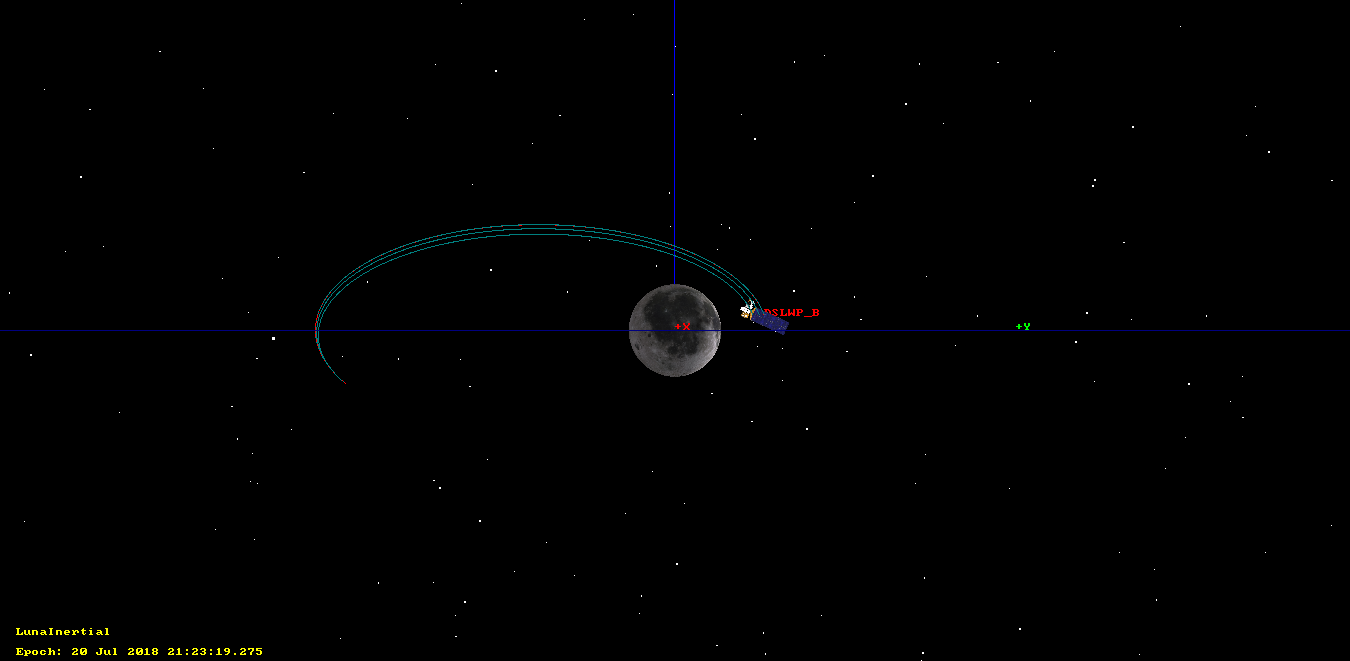
In my last post I presented my orbit determination of DLSWP-B using one lunar month of S-band Doppler measurements made by Scott Tilley VE7TIL. In this post, I will use the delta-velocity measurements from the VLBI experiment on 2018-06-10 to validate my orbital elements.
In the figures below, I compare between the sets of data: The old elements, obtained in this post:
DSLWP_B.SMA = 8762.40279943
DSLWP_B.ECC = 0.764697135746
DSLWP_B.INC = 18.6101083906
DSLWP_B.RAAN = 297.248156986
DSLWP_B.AOP = 130.40460851
DSLWP_B.TA = 178.09494681
The new elements obtained in my last post:
DSLWP_B.SMA = 8765.95638789
DSLWP_B.ECC = 0.764479041563
DSLWP_B.INC = 23.0301858287
DSLWP_B.RAAN = 313.64185464
DSLWP_B.AOP = 113.462338342
DSLWP_B.TA = 178.5519212
The elements obtained from the 20180610 tracking file published by Wei Mingchuan BG2BHC in dslwp_dev. This tracking file contains a list of ECEF position and velocity vectors for DSLWP-B. The first entry is taken as the orbital state and the orbit is propagated in GMAT, as done in this post. It would also be possible to calculate the delta-velocity directly from the ECEF data, but the results would be fairly similar and I already have a script to do it with GMAT orbit propagation.
A degree 2 polynomial fit to the VLBI observations. It turns out that the delta-velocity during the VLBI experiment can be approximated fairly well by a parabola, so it makes sense to use this as a reference. Note that this also implies that this set of delta-velocity measurements alone would be insufficient to perform orbit determination, as a degree 2 polynomial gives us 3 coefficients, while we would need to determine 6 parameters for the orbital state. Adding delta-range would only give us an extra variable, so orbit determination using VLBI would need several sets of measurements well space in time so that the orbit can be observed at different anomalies.
The figures below show a comparison between the four sets of data and the VLBI measurements.
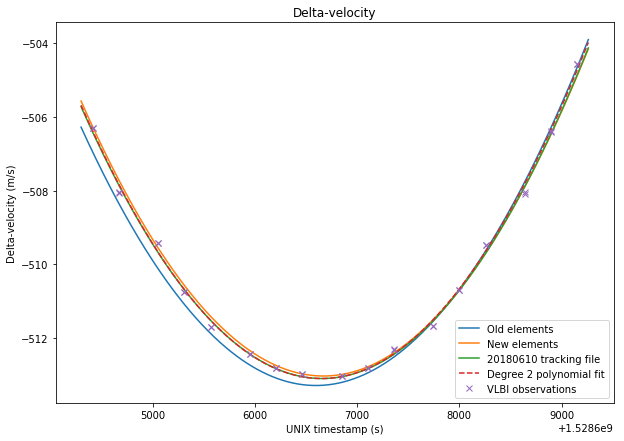
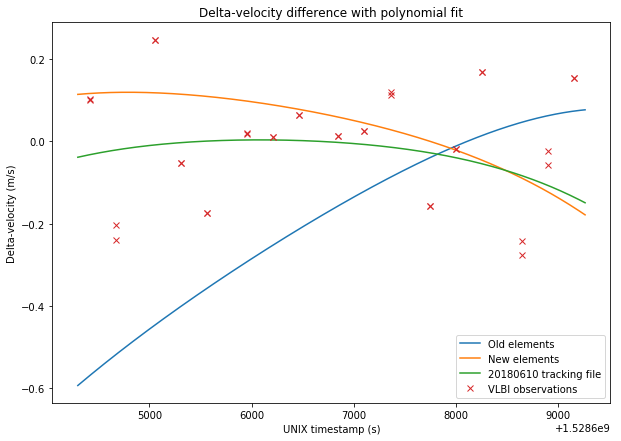
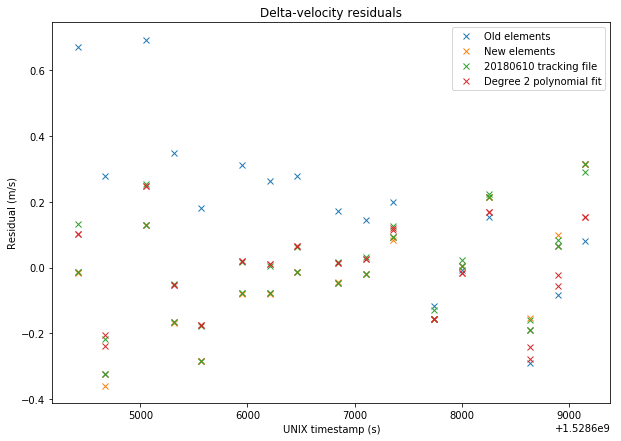
The RMS errors are respectively 0.248m/s for the old elements, 0.167m/s for the new elements, 0.156m/s for the tracking file, and 0.137m/s for the polynomial fit. Thus, we see that the newer elements represent a good improvement over the older elements. The tracking file gives a slightly better result than the new elements. However, the new elements should give good results over a long time span of over 20 days, as we have seen in the previous post, while the orbital parameters derived from the tracking files tend to change often.
The Jupyter notebook used to make these calculations has been updated in here.