In May 25, the Moon passed through the beam of my QO-100 groundstation and I took the opportunity to measure the Moon noise and receive the Moonbounce 10GHz beacon DL0SHF. A few days ago, in July 22, the Moon passed again through the beam of the dish. This is interesting because, in contrast to the opportunity in May, where the Moon only got within 0.5º of the dish pointing, in July 22 the Moon passed almost through the nominal dish pointing. Also, incidentally this occasion has almost coincided with the 50th anniversary of the arrival to the Moon of Apollo 11, and all the activities organized worldwide to celebrate this event.
The figure below shows the noise measurement at 10366.5GHz with 1MHz and a 1.2m offset dish, compared with the angular separation between the Moon and the nominal pointing of the dish (defined as the direction from my station to Es’hail 2). The same recording settings as in the first observation were used here.
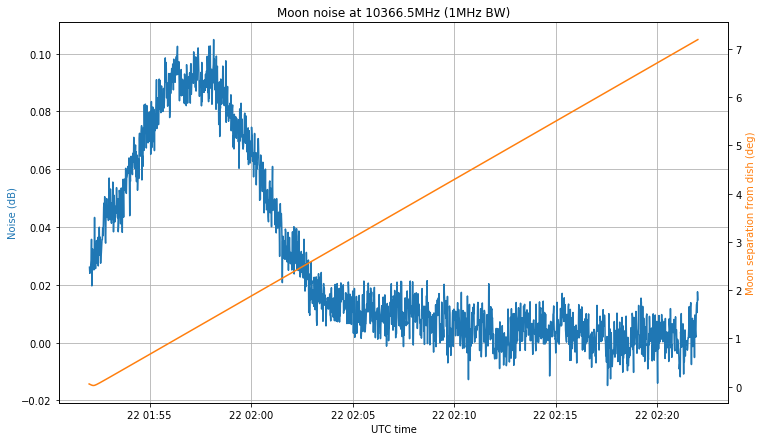
The first thing to note is that I made a mistake when programming the recording. I intended to make a 30 minute recording centred at the moment of closest approach, but instead I programmed the recording to start at the moment of closest approach. The LimeSDR used to make the recording was started to stream one hour before the recording, in order to achieve a stable temperature (this was one lesson I learned from my first observation).
The second comment is that the maximum noise doesn’t coincide with the moment when the Moon is closest to the nominal pointing. Luckily, this makes all the noise hump fit into the recording interval, but it means that my dish pointing is off. Indeed, the maximum happens when the Moon is 1.5º away from the nominal pointing, so my dish pointing error is at least 1.5º. I will try adjust the dish soon by peaking on the QO-100 beacon signal.
The noise hump is approximately 0.085dB, which is much better than the 0.05dB hump that I obtained in the first observation. It may not seem like much, but assuming the same noise in both observations, this is a difference of 2.32dB in the signal. This difference can be explained by the dish pointing error.
The recording I have made also covers the 10GHz Amateur EME band, but I have not been able to detect the signal of the DL0SHF beacon. Perhaps it was not transmitting when the recording was made. I have also arrived to the conclusion that the recording for my first observation had severe sample loss, as it was made on a mechanical hard drive. This explains the odd timing I detected in the DL0SHF signal.
The next observation is planned for October 11, but before this there is the Sun outage season between September 6 and 11, in which the Sun passes through the beam of the dish, so that Sun noise measurements can be performed.