It has been a while since the last time I wrote an update about Tianwen-1’s attitude. In that post I showed that Tianwen-1 had changed to a sun angle of 0 degrees with respect to the spacecraft’s X axis on 2020-10-22. Since then, nothing changed, even after the spacecraft arrived to Mars orbit on February 2021, so I have been sloppy and ignored the ADCS telemetry for quite a while.
As you may have heard, the 20 metre antenna at Bochum observatory had a failure at the beginning of June due to a thunderstorm. It has been under repair until the end of August, when it became operational again. As AMSAT-DL has now returned to receive telemetry from Tianwen-1 at Bochum, I am now reviewing the new data to see if anything interesting might have happened in the last months.
When plotting the new data I have learned that Tianwen-1 changed attitude during the release of the lander on May 14, and has maintained this new attitude until the present day.
Yesterday, May 14th, at around 23:18 UTC the Tianwen-1 rover Zhurong safely landed on the Utopia Planitia region of Mars. To follow this event, AMSAT-DL made a 7 hour livestream of the orbiter signals as received by the 20m antenna in Bochum observatory. In this livestream we could see the signal losses caused by the manoeuvres of the deorbit burn and collision avoidance burn. Analysis of the telemetry decoded at Bochum shows more details about these manoeuvres. This post is a detailed report of the landing.
In my last post about Tianwen-1, I explained how on 2021-02-23 the spacecraft would enter an orbit with a period of 2 Mars sidereal days. This would give a repeating ground track with periapsis passages over the intended landing site in Utopia Planitia. Almost one month has passed since then and AMSAT-DL has continued to receive telemetry state vectors every day with the Bochum 20 meter antenna. This data allows us to study the orbit in detail, including orbit perturbations and any station-keeping manoeuvres that are done to maintain the orbit. This post is my first analysis of the current orbit.
Last Saturday 2021-02-20 at 11:46:42 UTC Tianwen-1 passed the periapsis of its elliptical polar orbit at Mars and made a retrograde burn to reduce its apoapsis radius. The trajectory planning of the spacecraft can be seen in its Wikipedia page: the spacecraft first arrived into a low inclination elliptical orbit by making a Mars orbit insertion at periapsis, then coasted to apoapsis, where it performed a plane change, and then it arrived at periapsis, performing the manoeuvre described in this post.
Over the next few days the spacecraft should move into a reconnaissance orbit, which is given in Wikipedia to be a 265 x 60000 km orbit (having a period of 2 days) with an inclination of 86.9 degrees. However, the last burn hasn’t lowered the apoapsis that much. The current orbit is approximately 280 x 84600 km (3.45 day period) with an inclination of 87.7 degrees. A possible reason for using the current orbit, which has been described as a phasing orbit, will be explained in this post after reviewing the data we have about the burn.
Today at 9:00 UTC Tianwen-1 made its plane change manoeuvre, as reported by Xinhua. Yesterday I showed my planning for this manoeuvre. Shortly after the spacecraft returned to the high gain antenna after the manoeuvre, the Bochum 20m antenna operated by AMSAT-DL received state vectors with the new trajectory. These state vectors allow us to calculate the timestamp of the burn and the delta-V vector, as I have done in other occasions. It is convenient to remark that the state vectors that we are seeing right now are probably a prediction. In the next few days we will see updates in the trajectory as the Chinese DSN measures the effects of the actual burn and updates the onboard ephemerides.
Today, the Chinese media published a short piece of news stating that tomorrow, 2021-02-15, Tiawen-1 will make make a plane change to a polar orbit. The post is accompanied by an short video, which includes an animation depicting the manoeuvre. A screenshot of the video is shown below. As the spacecraft arrives to apoapsis, it effects a plane change into an ascending polar orbit.
Tianwen-1 plane change manoeuvre. Source 人民日报 in weibo.com
This is a good moment to review the maths behind a plane change manoeuvre and compute what the manoeuvre will look like.
Since launch, Tianwen-1 has transmitted as part of its telemetry some state vector data, giving its position and velocity vector every 32 seconds. This has allowed us to propagate, track and study its trajectory. We noticed the presence of the state vector data a few hours after launch, and since then we have received and decoded this data using the 20m antenna at Bochum observatory, which is operated by AMSAT-DL. This has allowed us to supply accurate orbit information to JPL HORIZONS, so that Amateur observers (and also some professional ones, for which Tianwen-1 is a useful and strong X-band beacon) can easily get ephemerides for the spacecraft.
Until now, the state vector data has encoded the spacecraft’s Cartesian position (in km) and velocity (in km/s) in a heliocentric reference frame. It is not completely clear if the frame is supposed to be ICRF or MJ2000, since the difference between the two is very small (see Section 3.5 in this paper by Kaplan) to be able to distinguish them with the data at hand, but we have always been using ICRF so far for consistency.
Today we have noticed that starting at some point on 2021-02-08, Tianwen-1 is now transmitting state vectors using a different, Mars-centric frame of reference. We don’t have the exact moment of the change. The last heliocentric vector we received was
This vector was received with one of the antennas at Allen Telescope Array, which I used as a backup since Bochum was unable to track that day due to a big snowfall.
The first Mars-centric state vector was received by Bochum the next day, and is
The change in the frame of reference is clear from the change in magnitude of the position vector. Ensuring that the Mars-centric state vectors are interpreted correctly is important to continue using the data accurately. In this post I give the assessment of the appropriate reference system to use.
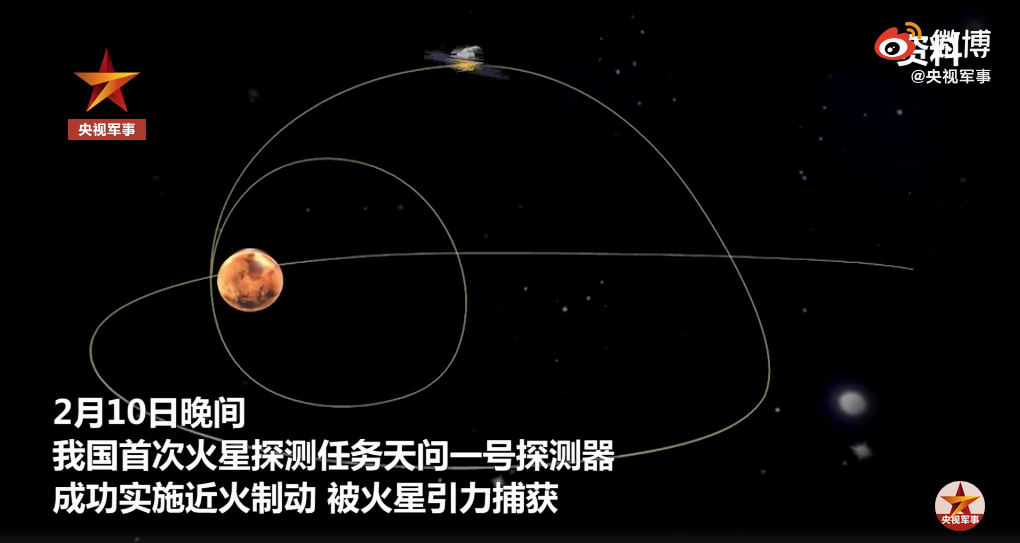
Today, 2021-02-05 at 12:00 UTC, Tianwen-1 has executed TCM-4. This is its last trajectory correction manoeuvre before the arrival to Mars orbit next Tuesday February 10. This was reported by Chinese media together with a black and white image of Mars taken recently by the spacecraft.
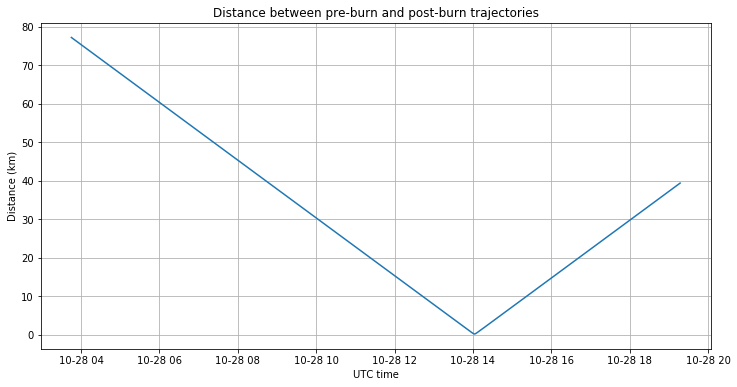
As usual, I have analysed this manoeuvre by propagating forwards the last state vector that we have from the spacecraft’s telemetry before the manoeuvre, propagating backwards the first state vector that we have after the manoeuvre, and finding the intersection point of the two trajectories.
A few days ago I posted about TCM3, the fourth trajectory correction made by Tianwen-1 so far. After some days, the Chinese DSN has performed precise orbit determination and updated the on-board ephemerides, so that we are now seeing the final trajectory in the telemetry state vectors.
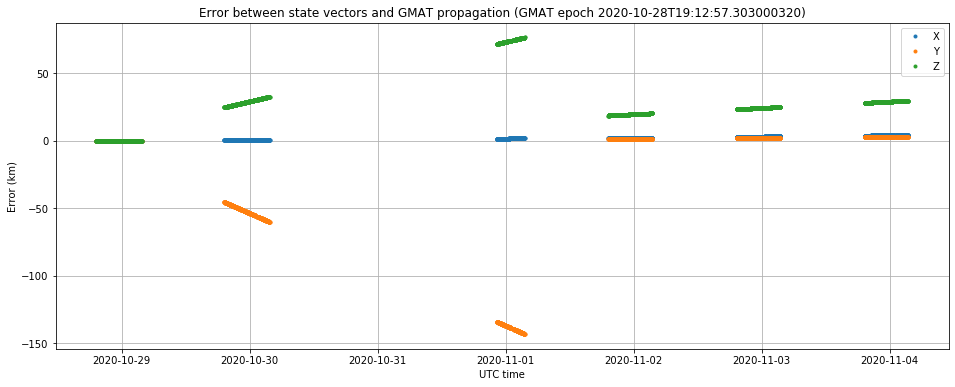
The figure below shows how the state vectors have been updated a couple of times following the TCM, as the DSN computes and uploads an improved trajectory solution. I have plotted this graph in the following way: I have taken the first state vector received after TCM3, on the UTC afternoon of 2020-10-28, and used it to propagate a trajectory in GMAT. The plot shows the difference between the state vectors and the GMAT trajectory.
TCM3 happened on 2020-10-28 at 14:00 UTC, so the reference trajectory computed in GMAT corresponds to the trajectory of the state vectors immediately following the TCM. These are based on a prediction of the burn performance, rather than on the actual results. The graph above shows clearly two changes in the trajectory, one on 2020-10-29, and another one on 2020-11-01.
Since we have already seen the same trajectory for three days without updates, I am confident that this trajectory is now final. The latest state vector we have today is
As always, this gives the UTC timestamp and the ICRF heliocentric position and velocity coordinates in km and km/s respectively.
I have re-run the calculations in the previous post by back-propagating a state vector from the UTC evening of 2020-11-01, which already belongs to the final trajectory. The change in delta-V in comparison to what I should in the previous post is small. The new delta-V is 2.13 m/s rather than 2.09 m/s, and the components have changed around 5%. The detailed calculations and data can be found in the updated Jupyter notebook.
On 2020-10-28 at 14:00 UTC, Tianwen-1 has made its third trajectory correction manoeuvre. This has been the next manoeuvre after the deep space manoeuvre at the beginning of October. According to the press release, this was a firing of the eight 25N thrusters intended as a minor correction and as a test of this propulsion system. I haven’t found the duration of the burn in the news.
I have followed the same method as in previous burns to compute the moment of the burn and the delta-V vector by extrapolating the telemetry orbit state vectors received by AMSAT-DL in Bochum before and after the burn. This extrapolation locates the burn at 14:02:28 UTC. Note that this time is an approximation for the mid-point of the burn.
The delta-V vector was, in m/s
[-0.6575566 , -0.11513034, 1.97535319],
and the magnitude was 2.09m/s. Assuming a mass of 5000kg and eight 25N thrusters, it would take a burn of 52 seconds to achieve this delta-V.
Update 2020-10-30: according to this news article, the duration of the burn was 42.8 seconds which is some 18% smaller than my estimate. Note that my estimate didn’t take into account the mass of fuel spent by the deep space manoeuvre, which I estimated to be 457kg (giving a decrease in mass of 9%).
Apparently this burn has lowered the periares height significantly in comparison to the trajectory following the deep space manoeuvre, which was around 18000km. Thanks to Achim Vollhardt for noticing this. It’s difficult for me to give a good estimate of the new periares height, because it is quite sensitive to orbit perturbations. I’ve obtained anything between 30 and 800 km by enabling and disabling solar radiation pressure in the GMAT propagator, and we don’t have a good estimate of the spacecraft’s cross-section and reflection coefficient.
The figure below shows one of the GMAT simulations. Note that the periares is near the equator, which is good for insertion into a low inclination orbit.
Periares passage in GMAT
Keep in mind that according to the media still one more trajectory correction manoeuvre remains and that the data used in this post comes straight from the spacecraft’s telemetry, and as such is most likely based on a prediction of the burn rather than on the actual performance of the burn. In a few days, I will publish a new post when the Chinese DSN perform precise orbit determination and upload updated orbital information to the spacecraft.