A few days ago, Paul Marsh M0EYT told me that he had seen something interesting in his recording of Tianwen-1‘s signal during the previous night. Paul usually does some nice videos of the signal waterfall by doing screen captures of Spectrum Lab. These clearly show events such as frequency jumps due to groundstation locking, and any high-speed data transmissions. You can see some of these in his Twitter feed.
The waterfall that Paul talked me about can be seen in this video. It corresponds to the night between September 20 and 21. Note that the data sidebands show some horizontal stripes. For a while they disappear altogether, and at other times their density changes. This is what caught Paul’s eye.
Paul was convinced that when the stripes disappeared, more data was being transmitted in the signal. I was a bit sceptical about it, but clearly there was something changing in the signal. I thought about the “dancing” related to the subcarrier and data clocks sliding. However, after analysing the signal, I saw that Paul was completely right, as I will explain here. After knowing exactly what happens, I’m still quite amazed that this shows up in the Spectrum Lab waterfall.
As you may recall from an older post, Tianwen-1’s telemetry signal transmits data from two spacecraft IDs: 245, which shows all the interesting data, so it is believed to be the orbiter, and 82, which has mostly static data, so it is believed to be the lander. Moreover, spacecraft 245 uses several virtual channels to transmit different kinds of data. During usual low data rate telemetry, spacecraft 245 uses only two virtual channels: virtual channel 1 to transmit real time telemetry, and virtual channel 3 to transmit idle frames. Spacecraft 82 only uses virtual channel 1, as far as we’ve been able to see.
From our early analysis of the signal, r00t.cz (see his analysis) and I thought that bandwidth was statically allocated: 25% for spacecraft 82 virtual channel 1, 50% for spacecraft 245 virtual channel 1, and 25% for spacecraft 245 virtual channel 3. However, after looking at the data from this night, now I know this is not the case.
The figure below shows the bandwidth sharing. This is computed by looking at what fraction of frames are of each type in a window of 100 frames. We see that real time telemetry from the orbiter (spacecraft 245 VC 1) always gets 50%, but in this particular recording spacecraft 82 changes from 50% to 25% and finally to 0%. The idle frames in spacecraft 245 VC 3 get the remaining bandwidth.
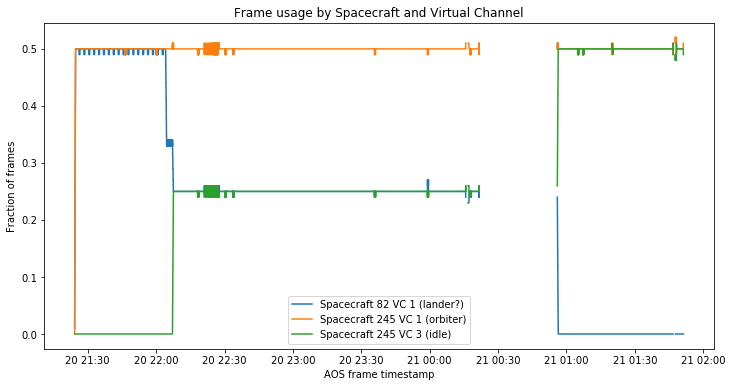
It is also interesting that there are some small glitches where the sharing changes a little. This might be due to lost frames in the decoder, though. Note that this figure and the rest of the analysis has been done with the data collected at the Bochum 20m antenna, so it doesn’t match the time interval in Paul’s video. In particular, the first part, where we have no idle frames coincides with the part of Paul’s video in which no horizontal stripes are seen.
The way this works is by changing the sequence in which frames are allocated to each spacecraft and VC pair. These seems to work with sequences of four frames. During the first part of the recording the sequence is (245,1), (82,1), (245,1), (82,1). During the second part, this changes to (245,1), (82,1), (245,1), (245,3). Finally, during the third part the sequence is (245,1), (245,3), (245,1), (245,3).
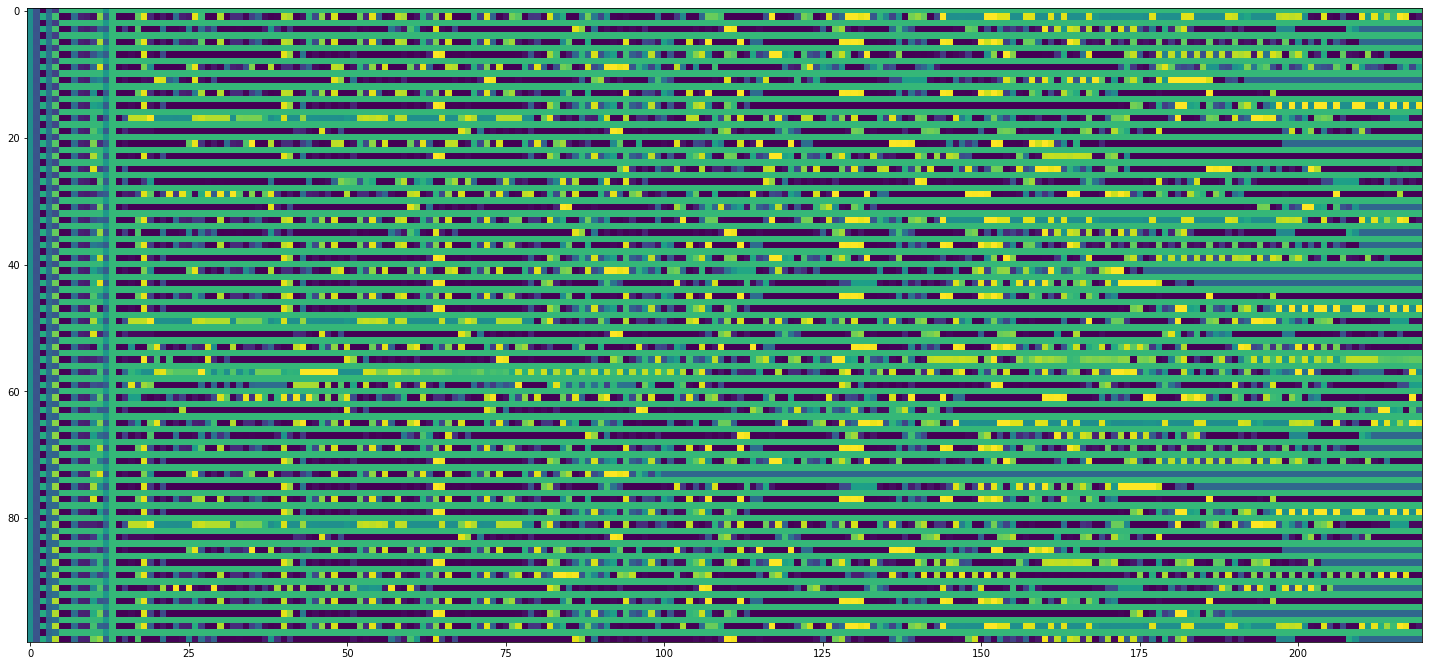
Since the payload of the idle frames in virtual channel 3 is all 0xaa bytes, these three different parts can be easily seen if we plot the frames as a raster image, with one frame per line and colour-coded bytes. The 0xaa bytes look green.
The figures below show each of the parts. We can see no green idle frames in the first part, an idle frame every four frames in the second, and an idle frame every other frame in the third part.
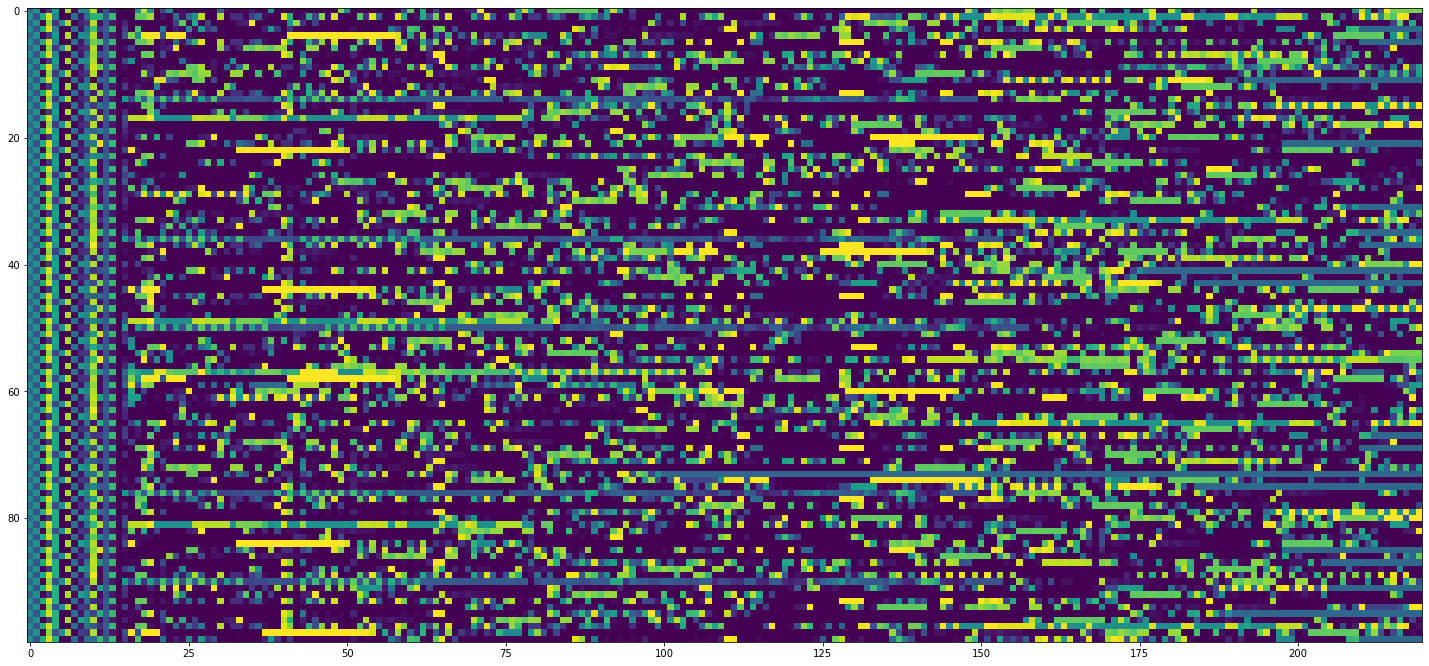

When shown in this way, the texture of the data changes in each of the parts, but it is not so clear to me how the changes in the horizontal stripes in Paul’s waterfall happen. We should keep in mind that the data is scrambled with the CCSDS synchronous scrambler and then convolutionally encoded.
Therefore, I think that any patterns that appear in the spectrum will come from the fact that, when idle frames are sent, one out of every four frames is equal, or every other frame is equal. I think this should cause spectral lines spaced one over the duration of two (or four frames). Since a frame takes 0.25 seconds to send, this means spectral lines every 2Hz or 1Hz. So it’s not something you would easily see in the spectrum.
Moreover, the stripes that appear in the waterfall are much longer than 0.25 seconds (and also the gaps between the stripes), so they can’t be individual idle frames. I think they must be caused by some Moiré effect.
In any case, Paul is right, and now that we know what happens, he is able to see at a glance in the waterfall what amount of useful data is being sent.
So what causes these changes in the amount of data that is sent by spacecraft 82? It turns out that the first part, where the occupied bandwidth is 50%, mixes real-time and replay data, according to the replay flag in the AOS primary header. We see that every other frame from spacecraft 82 has the replay flag enabled. The space packets in the replayed data also show uninteresting static data.
The frames with the replay flag follow a totally different virtual channel frame count than those without the replay flag, so we see the frame count jumping back and forth. I’m not sure if this is totally compliant with the CCSDS recommendations.
The analysis for this post has been done in this Jupyter notebook.