Today I’ve finally had some time to test the LilacSat-1 Codec2 downlink on the air. I’ve been transmitting and listening to myself on the downlink during the 17:16 UTC pass over Europe from locator IN80do. The equipment used is a Yaesu FT-2D for the FM uplink, a FUNcube Dongle Pro+ and my decoder from gr-satellites for the downlink, and a handheld Arrow satellite yagi (3 elements on VHF and 7 elements on UHF). Here I describe the results of my test.
Category: Space
Spacecraft and space science
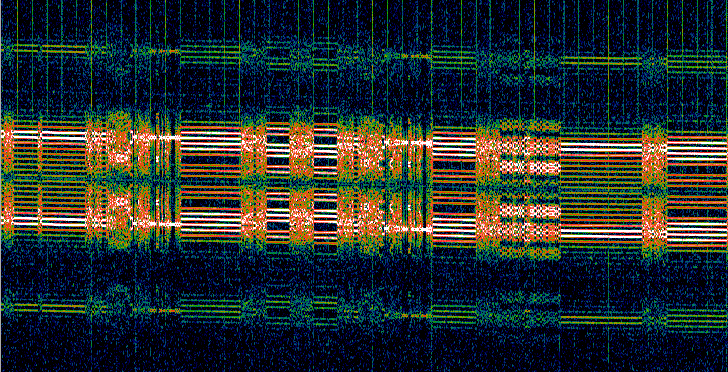
Waterfalls from QB50
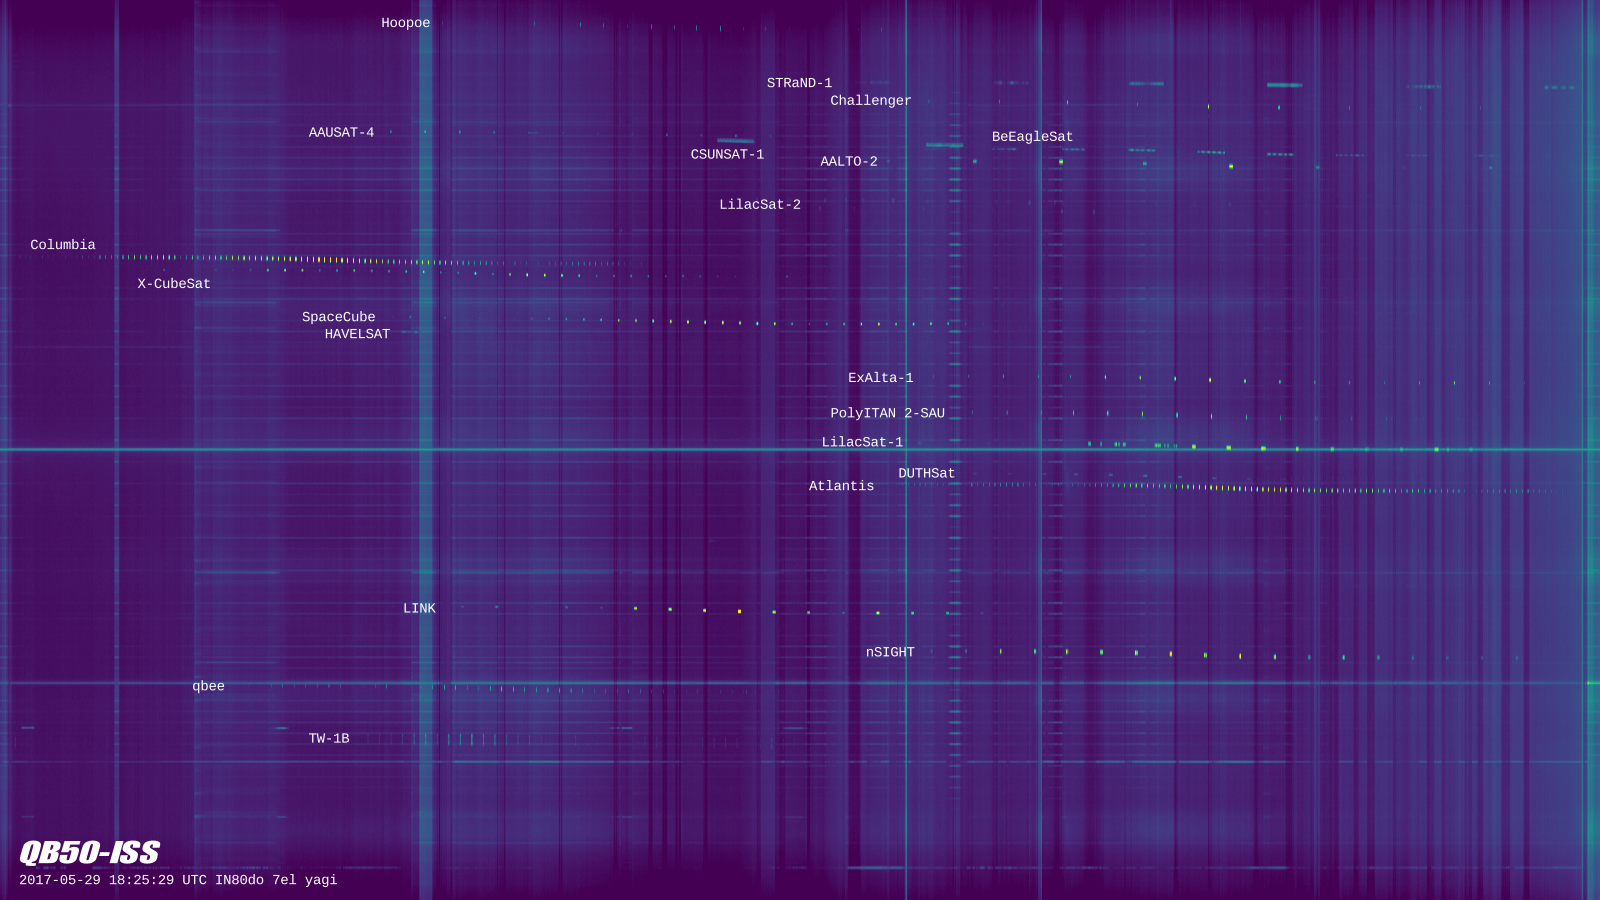
In the previous post, I analysed a QB50 recording. Now I have prepared some waterfalls from my recording using the procedure I already described a while ago. The image above is obtained from a 1600×1024 waterfall with a resolution of 2.93kHz or 0.86s per pixel. I have labelled all the satellites and cropped it to a 1600×900 image that now I’m using as my desktop wallpaper.
I have also made a large 14120×16384 image with a resolution of 183.1Hz or 0.1s per pixel. The image can be downloaded here (142MB). I have found the following interesting crops within the large image. Remember that you can click on each image to view it in full size.
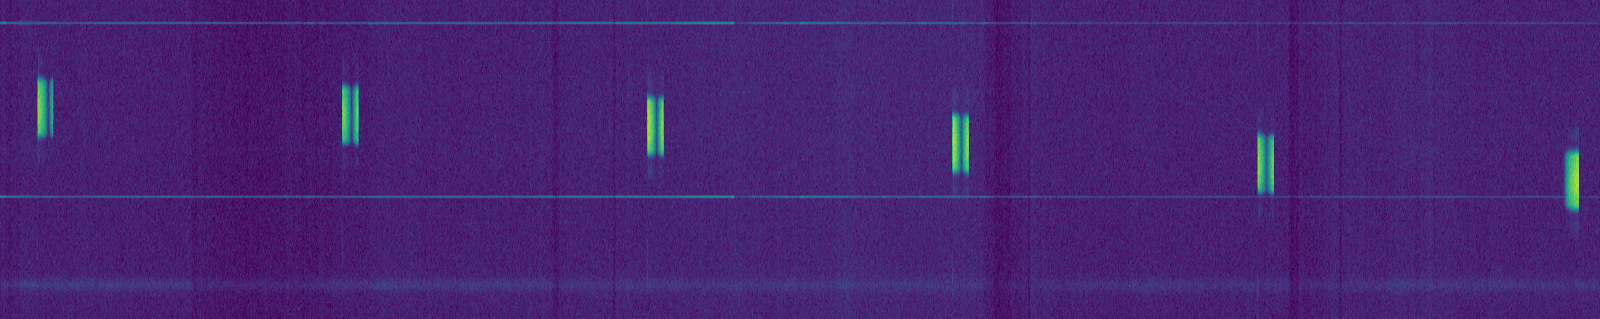
The fast fading that I detected in nSIGHT is clearly visible below. Note that the beacon period is almost, but not quite, an integer multiple of the fading period.
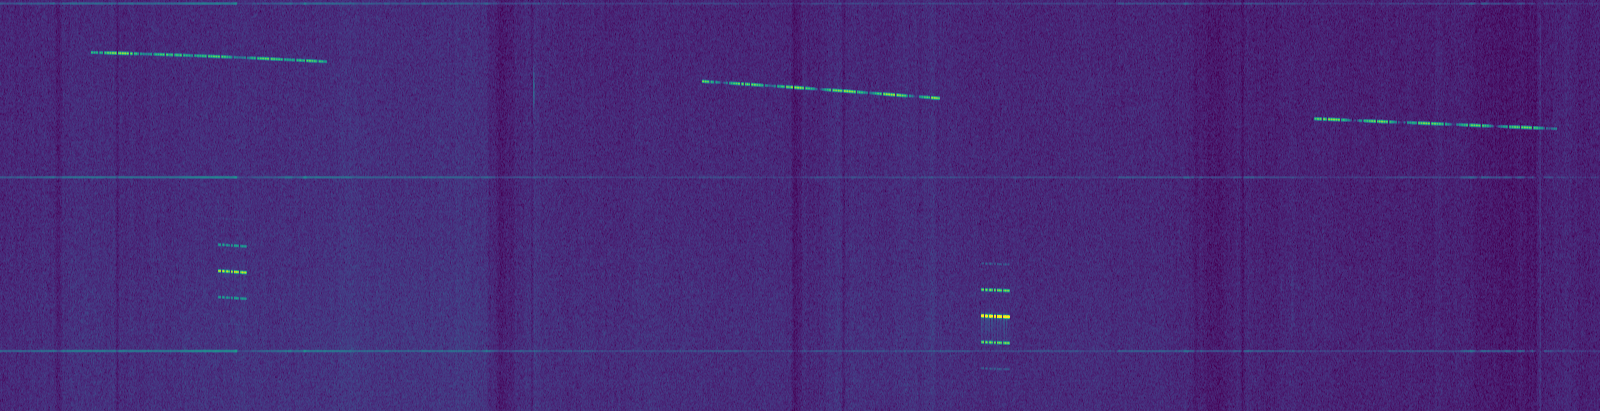
In the image below, we can see that SpaceCube is not very stable in frequency. The carrier frequency tends to rise rapidly each time that the transmitter goes on. Also, the overall trend is a frequency increase, counteracting the frequency decreasing effect of Doppler. This excerpt is near the end of SpaceCube’s pass, so the change in Doppler is not so large. The other French satellite, X-CubeSat, also shows a similar behaviour.

AAUSAT-4 usually transmits in 4k8 FSK using CCSDS FEC, but it also transmits a CW beacon sometimes. Both can be seen below.

Finally, a couple of CW satellites with interesting behaviour. On the upper part of the image below we can see BeEagleSat with fading. On the lower part, we can see Aalto-2 with its characteristic sidebands.
A tour of QB50
The QB50 project consists in a constellation of cubesats with the goal of studying the thermosphere. The cubesats are built by different universities around the world and each of them carries one of three different scientific instruments. A total of 36 cubesats have been built for the QB50 project. All of them transmit on the 70cm Amateur satellite band. A total of 28 were launched to the ISS on April 18th on the Cygnus CRS-7 resupply ship. Over the last two weeks, they have been released from the ISS. The complete launch schedule and radio information can be found here (note that the launches on May 23rd were delayed due to an unforeseen EVA). Several other non-QB50 cubesats, some of them transmitting in the Amateur bands, have also been released together with the QB50 satellites. This is probably the time that more Amateur satellite have been released at the same time. The satellites have not separated much yet, giving a great opportunity to record a single pass and analyse the telemetry of all the satellites.
A few days after the release of all the 28 QB50 cubesats, on May 29th at 18:25:29 UTC, I made an SDR recording of the complete pass of all the cubesats. The recording spans the 3MHz of the 70cm Amateur satellite band (435-438MHz) and lasts 23 minutes and 08 seconds. It was made from locator IN80do using a 7 element handheld yagi (the Arrow satellite yagi) held in the vertical polarization and a LimeSDR. The gain of the LimeSDR was set to maximum, but no external LNA was used. Here I look at the recording, list the satellites heard, and decode their telemetry.
Decoding AO-40 uncoded telemetry
AO-40 is an Amateur satellite that was active between 2000 and 2004. It had several transponders and beacons covering many bands from HF to microwave and its position on a HEO orbit provided several consecutive hours of coverage each day and allowed long distance contacts. Since then, many interesting things have happened with Amateur satellites, particularly the high increase of the number of cubesats that is happening over the last few years, but even so, we haven’t seen again any other satellite with the characteristics of AO-40 nor it is to be expected in the near future.
I was quite young when AO-40 was operational, so for me this is all history. However, Pieter N4IP has posted recently on Twitter some IQ recordings of AO-40 that he made back in 2003. I have been playing with these recordings to see how AO-40 was like. One of the things I’ve dong is to write my own telemetry decoder using GNU Radio.
AO-40 transmitted telemetry using 400bps BPSK. There were two modes: an uncoded mode which used no forward error correction and an experimental FEC mode proposed by Phil Karn KA9Q. The FEC mode was used later in the FUNcube satellites, and I’ve already talked about it in a previous post. The beacon in Pieter’s recordings is in uncoded mode. Here I describe this mode in detail and how my decoder works. The decoder and a small sample taken from Pieter’s recordings have already been included in gr-satellites.
Low latency decoder for LilacSat-1
LilacSat-1 is one of the QB50 project cubesats. It will be released tomorrow from the ISS. The most interesting aspect of this satellite is that it has an Amateur Radio transponder with an FM uplink on the 2m band and a Codec2 1300bps digital voice downlink on the 70cm band. It is the first time that an Amateur satellite really uses digital voice, as previous tests have only used an analog FM repeater to relay D-STAR and similar digital voice modes. LilacSat-1 however implements a Codec2 encoder in software using its ARM processor. I have talked about LilacSat-1 Codec2 downlink already in this blog. Here I present a low latency decoder for the digital voice downlink that I have recently included in gr-satellites.
gr-satellites refactored
In August last year I started my gr-satellites project as a way to make my experiments in decoding Amateur Satellite telemetry easier to use for other people. Since then, gr-satellites has become a stable project which supports 17 satellites using several different protocols. However, as time has gone by, I have been adding functionality in new GNU Radio OOT modules. Eventually, the core of gr-satellites depended on 5 OOT modules and another 7 OOT modules were used for each of the satellite families. This makes gr-satellites cumbersome to install from scratch and it also makes it difficult to track when each of the OOT modules is updated.
I have now refactored gr-satellites and included most of the OOT modules into gr-satellites, so that it is much easier to install and update. The only OOT modules I have kept separate are the following:
- gr-aausat, because it doesn’t use libfec for FEC decoding, and includes its own implementation of a Viterbi and RS decoder. Eventually I would like to modify gr-aausat to make it use libfec and include it into gr-satellites.
- beesat-sdr, because it is actively developed by TU Berlin and I have collaborated some code with them. Also, the implementation of the decoder is quite different from everything else in gr-satellites.
- gr-lilacsat, because it is actively developed by Harbin Institute of Technology and I have collaborated some code with them. However, as I explained in a previous post, the FEC decoding for these satellites is now done very differently in gr-satellites in comparison to gr-lilacsat, as I have replaced many custom blocks by stock GNU Radio blocks. I will have to examine carefully how much code from gr-lilacsat is actually needed in gr-satellites.
The refactored version is already available in the Github repository for gr-satellites. Users updating from older versions should note that gr-satellites is now a complete GNU Radio OOT module instead of a collection of GRC flowgraphs, so it should be built and installed with cmake as usual (see the README). The GRC flowgraphs are in the apps/ folder.
The OOT modules that have been included into gr-satellites will be deprecated and no longer developed independently. I will leave their Github repositories up with a note pointing to gr-satellites.
This is not the end of the story. There are some more things I want to do with gr-satellites in the next few weeks:
- Use cmake to build and install hierarchical flowgraphs, saving the user from this cumbersome step.
- Use cmake to build the python scripts associated to the decoders.
- Collect in a Git submodule the sample WAV files that are scattered across the different OOT modules. Add WAV samples for missing satellites. Use these WAVs to test decoders, perhaps even with some automation by a script.
And of course, there are many QB50 project satellites being launched starting next week. I’ll try to keep up and add decoders for them, especially for the ones using not so standard modes. I already have a working decoder for Duchifat-2, since I have been collaborating with their team at Herzliya Space Laboratory. I will also adapt the LilacSat-1 decoder from gr-lilacsat. This decoder has already been featured in this blog.
GNU Radio decoder for AO-73
During the last few days, I have been talking with Edson PY2SDR about using GNU Radio to decode digital telemetry from AO-73 (FUNcube-1) and other FUNcube satellites. I hear that in Virginia Tech Groundstation they have a working GNU Radio decoder, but it seems they never published it.
The modulation that the FUNcube satellites use is DBPSK at 1200baud. The coding is based on a CCSDS concatenated code with a convolutional code and Reed-Solomon, but it makes extensive use of interleaving to combat the fading caused by the spin of the spacecraft. This system was originally designed by Phil Karn KA9Q for AO-40. Phil has a description of the AO-40 FEC system in his web and there is another nice description by James Miller G3RUH.
I took a glance at this documents and noted that it would be a nice and easy exercise to implement a decoder in GNU Radio, as I have most of the building blocks that are needed already working as part of gr-satellites. Today, I have implemented an out-of-tree module with a decoder for the AO-40 FEC in gr-ao40. There is another gr-ao40 project out there, but it seems incomplete. For instance, it doesn’t have any code to search for the syncword. I have also added decoders for AO-73 and UKube-1 to gr-satellites.
The signal processing in gr-ao40 is as described in the following diagram taken from G3RUH’s paper.
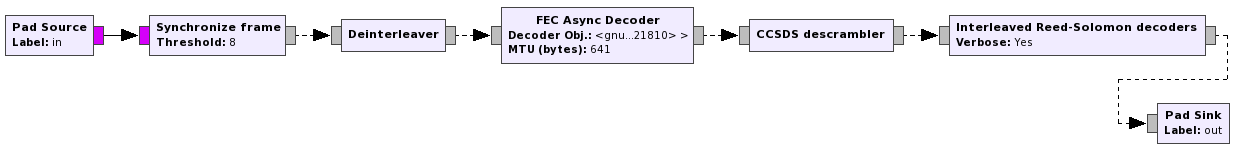
First, the distributed syncword is searched using a C++ custom block. It is possible to set a threshold in this block to account for several bit errors in the syncword. De-interleaving is done using another C++ custom block. For Viterbi decoding, I have used the “FEC Async Decoder” block from GNU Radio, since I like to use stock blocks when possible. Then, CCSDS descrambling is done with a hierarchical block from gr-satellites. Finally, the interleaved Reed-Solomon decoders are implemented in a C++ custom blocks that uses Phil Karn’s libfec.
The complete FEC decoder is implemented as a hierarchical block as show in the figure below.
Open telecommand for BY70-1
Recently, Wei BG2BHC has published instructions for the use of BY70-1’s camera by Amateurs. Essentially, there are three commands that can be used: 0x00 to take a picture and send it, 0x55 to take a picture and store it in memory, and 0xaa to send the picture stored in memory. He also gives the modulation and coding details for the commands. They use AX.25 with 1000baud FM-AFSK with tones at 1000Hz and 1833.33Hz. The AX.25 frames are UI frames containing a single byte with the command (0x00, 0x55 or 0xaa as described above). For ease of use, he also gives WAV recordings of the three commands, so they can be played back easily into an FM transmitter by any Amateur. Here I look at the contents of these WAV files and how to process and create this kind of packets.
Coding for HIT satellites (and other CCSDS satellites)
The Harbin Institute of Technology satellites LilacSat-2, BY70-1 and the upcoming LilacSat-1 all use a concatenated code with an \(r=1/2, k=7\) convolutional code and a (255,223) Reed-Solomon code according to the CCSDS TM Synchronization and Channel Coding blue book specifications. The GNU Radio decoder gr-lilacsat by Wei BG2BHC includes a custom implementation of the relevant part of the CCSDS stack, probably ported into GNU Radio from some other software.
Recently, I have been working on decoding KS-1Q and I’ve seen that it uses the same CCSDS coding as the HIT satellites. This has made me realise that most of this CCSDS coding can be processed using stock GNU Radio blocks, without the need for custom blocks. The only exception is Reed-Solomon decoding. This can be done easily with gr-libfec, which provides an easy interface from GNU Radio to Phil Karn’s libfec. Here I look at the details of the CCSDS coding and how to process it with GNU Radio. I’ve updated the decoders in gr-satellites to use this kind of processing. I’ll also talk about the small advantages of doing it in this way versus using the custom implementation in gr-lilacsat.
KS-1Q decoded
In a previous post, I talked about my attempts to decode KS-1Q. Lately, WarMonkey, who is part of the satellite team, has been giving me some extra information and finally I have been able to decode the packets from the satellite. The decoder is in gr-ks1q, together with a sample recording contributed by Scott K4KDR. I’ve also added support for KS-1Q in gr-satellites. Here I look at the coding of the packets in more detail.