At the beginning of August I visited the Allen Telescope Array (ATA) for the Breakthrough Listen REU program field trip (I have been collaborating with the REU program for the past few years). One of the things I did during my visit was to use an ADALM Pluto running Maia SDR to do a very quick scan of the radio frequency interference (RFI) on-site. This was not intended as a proper study of any sort (for that we already have the Hat Creek Radio Observatory National Dynamic Radio Zone project), but rather as a spoor-of-the-moment proof of concept.
The idea was to use equipment I had in my backpack (the Pluto, a small antenna, my phone and a USB cable), step just outside the main office, scroll quickly through the spectrum from 70 MHz to 6 GHz, stop when I saw any signals (hopefully not too many, since Hat Creek Radio Observatory is supposed to be a relatively quiet radio location), and make a SigMF recording of each of the signals I found. It took me about 15 minutes to do this, and I made 6 recordings in the process. A considerable amount of time was spent downloading the recordings to my phone, which takes about one minute per recording (since recordings are stored on the Pluto DDR, only one recording can be stored on the Pluto at a time, and it must be downloaded to the phone before making a new recording).
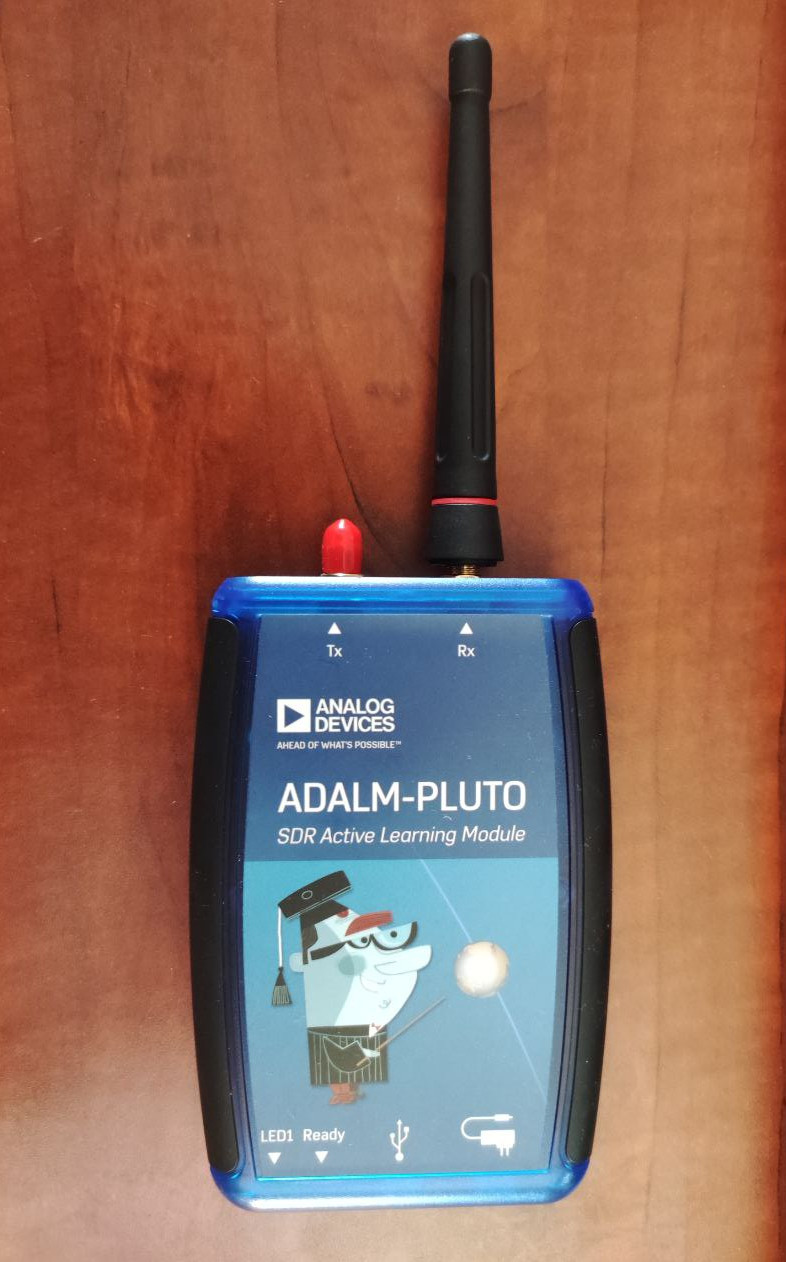
This shows that Maia SDR can be a very effective tool to get a quick idea of how the local RF environment looks like, and also to hunt for local RFI in the field, since it is quite easy to carry around a Pluto and a phone. The antenna I used was far from ideal: a short monopole for ~450 MHz, shown in the picture below. This does a fine job at receiving strong signals regardless of frequency, but its sensitivity is probably very poor outside of its intended frequency range.
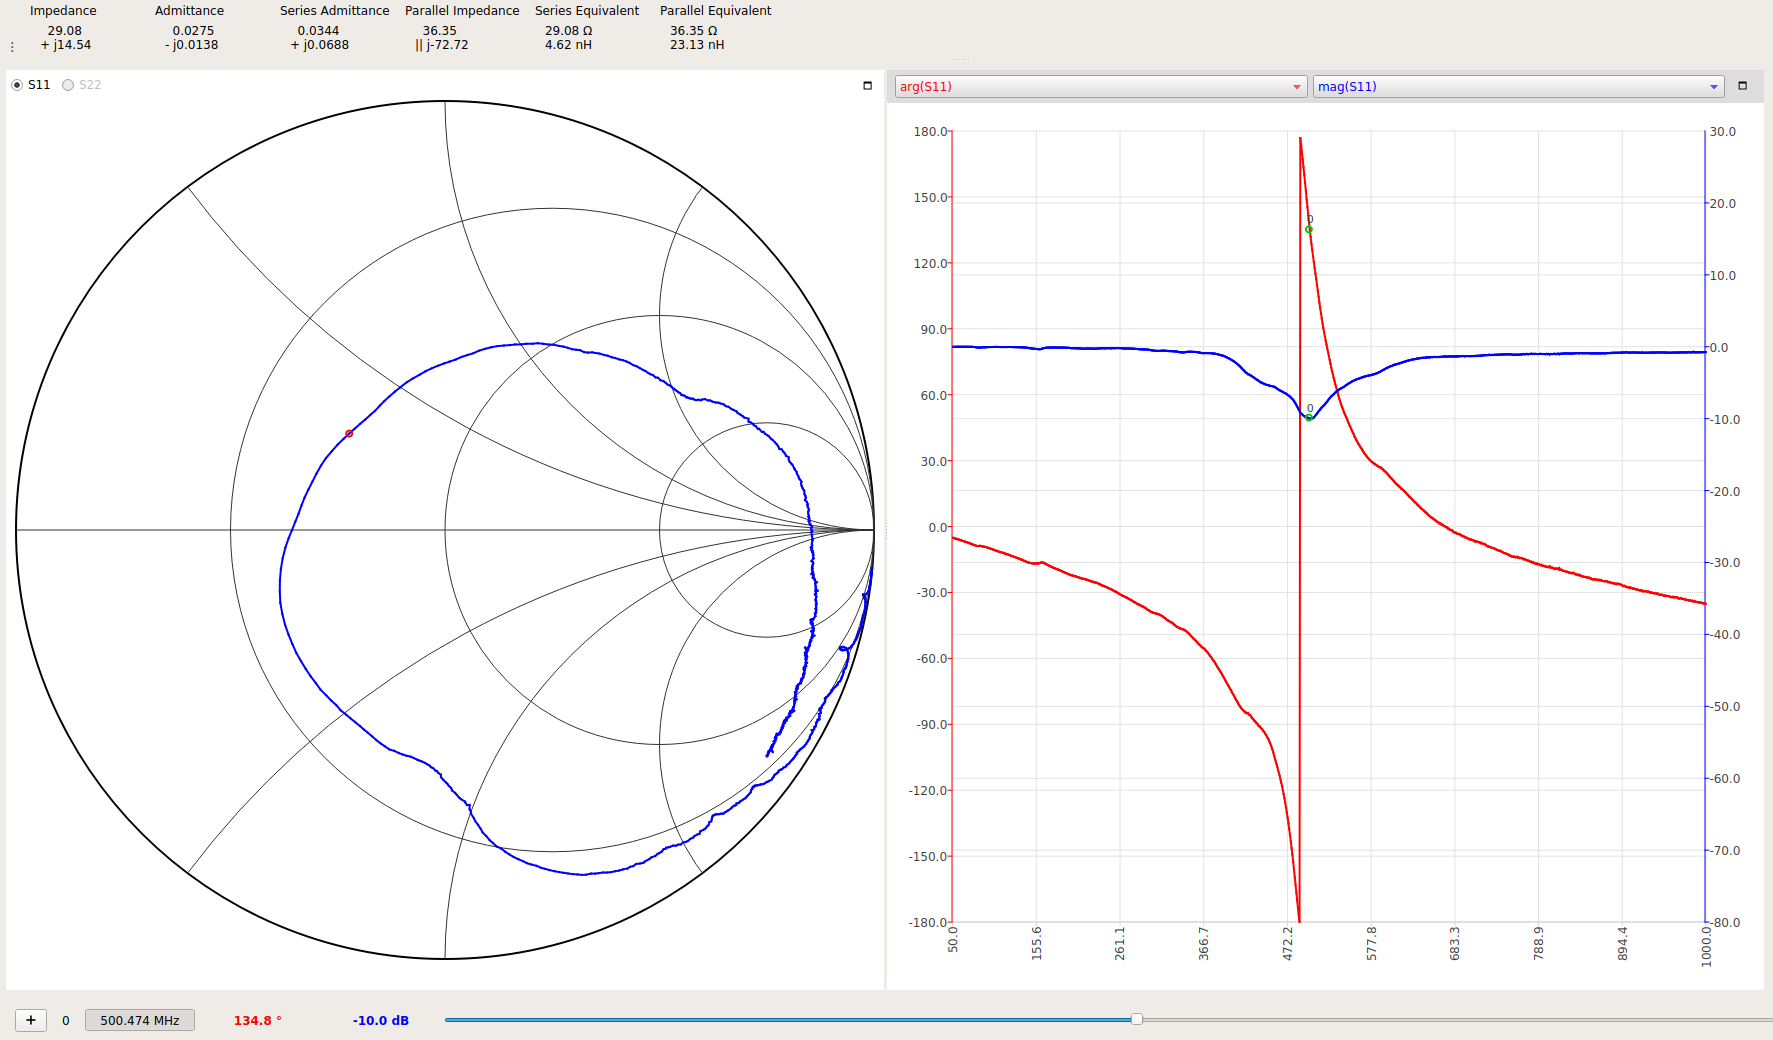
The following plot shows the impedance of the antenna measured with a NanoVNA V2. The impedance changes noticeably if I put my hand on the NanoVNA, with the resonant peak shifting down in frequency by 50 to 100 MHz. Therefore, this measurement should be taken just as a rough ballpark of how the antenna looks like on the Pluto, which I was holding with my hand.
As the antenna I used for this survey is pretty bad, the scan will only show signals that are actually very strong on the ATA dishes. The log-periodic feeds on the ATA dishes tend to pick up signals that do not bounce off the dish reflectors, and instead arrive to the feed directly from a side. This is different from a waveguide type feed, in which signals need to enter through the waveguide opening. Therefore, besides having the main lobe corresponding to a 6.1 m reflector, the dishes also have relatively strong sidelobes in many directions, with a gain roughly comparable to an omnidirectional antenna. The system noise temperature of the dishes is around 100 to 150 K (including atmospheric noise and spillover), while the noise figure of the Pluto is probably around 5 dB. This all means that the dishes are more sensitive to detect signals from any direction that the set up I was using. In fact, signals from GNSS satellites from all directions can easily be seen with the dishes several dB above the noise floor, but not with this antenna and the Pluto.
Additionally, the scan only shows signals that are present all or most of the time, or that I just happened to come across by chance. This quick survey hasn’t turned up any new RFI signals. All the signals I found are signals we already knew about and have previously encountered with the dishes. Still, it gives a good indication of what are the strongest sources of RFI on-site. Something else to keep in mind is that the frequency range of the Allen Telescope Array is usually taken as 1 – 12 GHz. Although the feeds probably work with some reduced performance somewhat below 1 GHz, observations are done above 1 GHz. Therefore, none of the signals I have detected below 1 GHz are particularly important for the telescope observations, since they are not strong enough to cause out-of-band interference.
I have published the SigMF recordings in the Zenodo dataset Quick RFI Survey at the Allen Telescope Array. All the recordings have a sample rate of 61.44 Msps, since this is what I was using to view the largest possible amount of spectrum at the same time, and a duration of 2.274 seconds, which is what fits in 400 MiB of the Pluto DDR when recording at 61.44 Msps 12 bit IQ (this is the maximum recording size for Maia SDR). The published files are as produced by Maia SDR. At some point it could be interesting to add additional metadata and annotations.
In the following, I do a quick description of each of the 6 recordings I made.
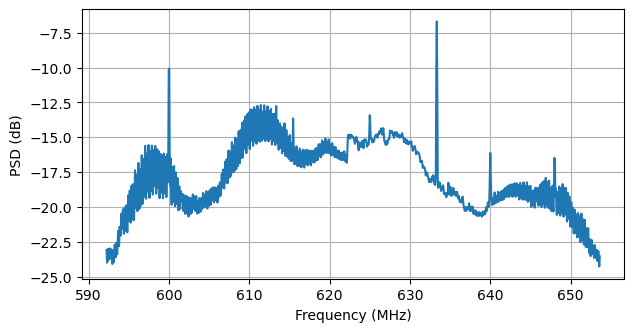
592.24 – 653.68 MHz
Recording file: 2023-08-03-15-37-20_atarfi.sigmf
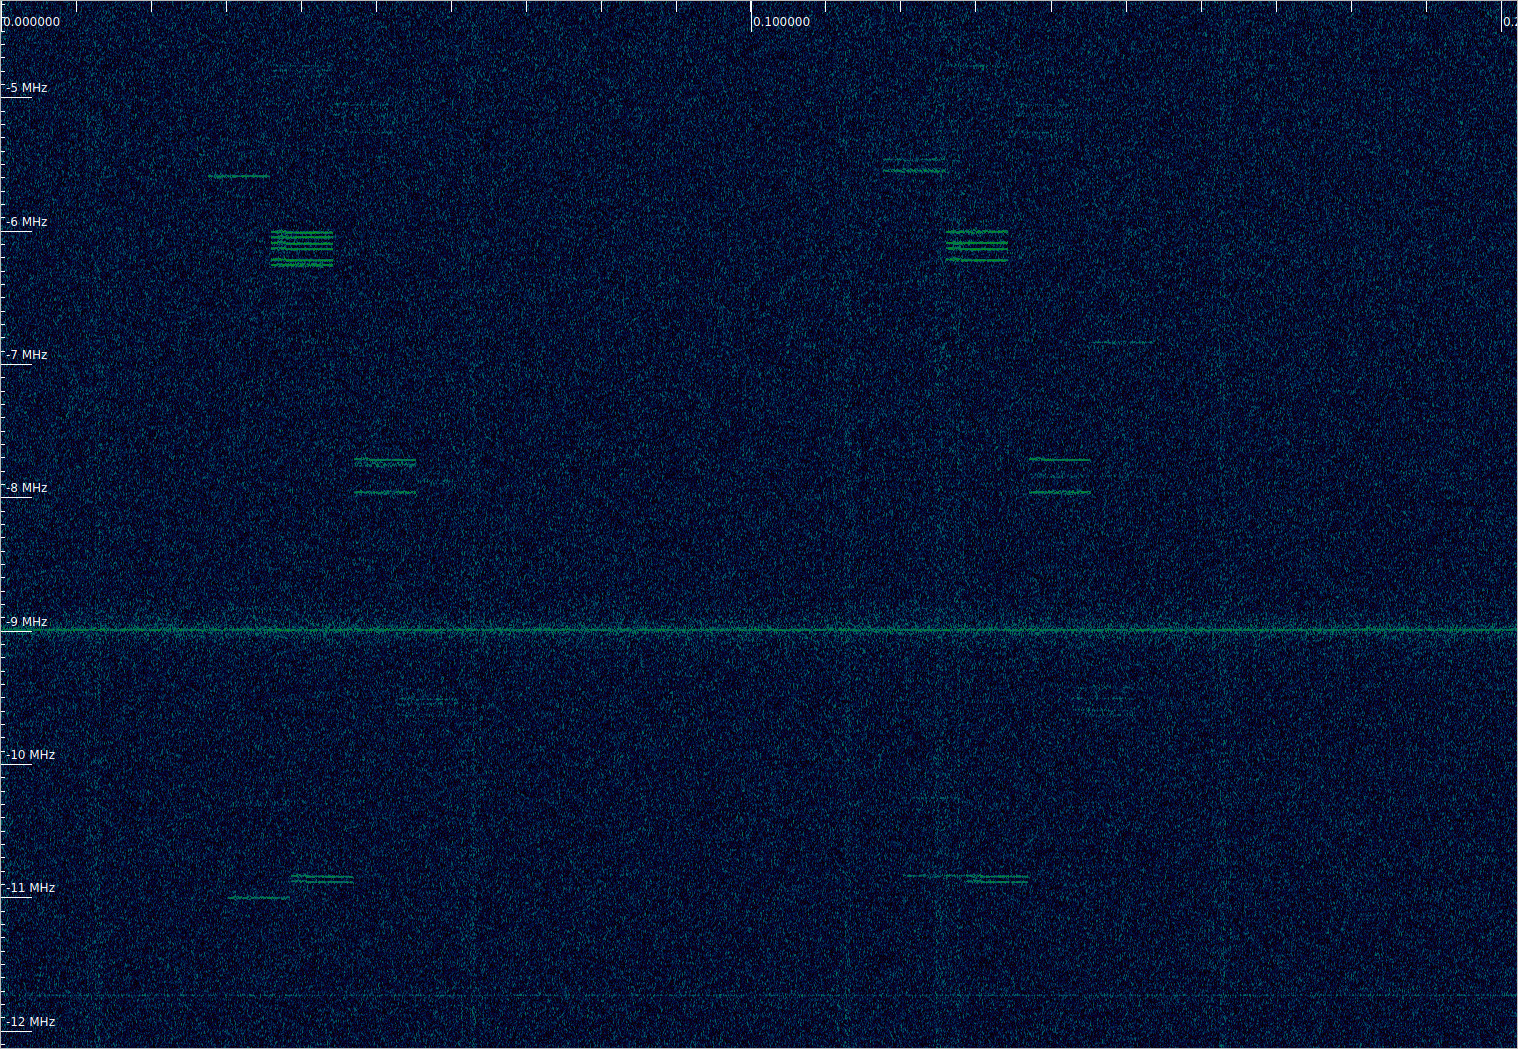
Here are two rather weak signals that look like OFDM cellular signals (LTE or 5G NR). One of them is a 5 MHz carrier, and the other is a 10 MHz carrier. They are separated by a narrow guardband.
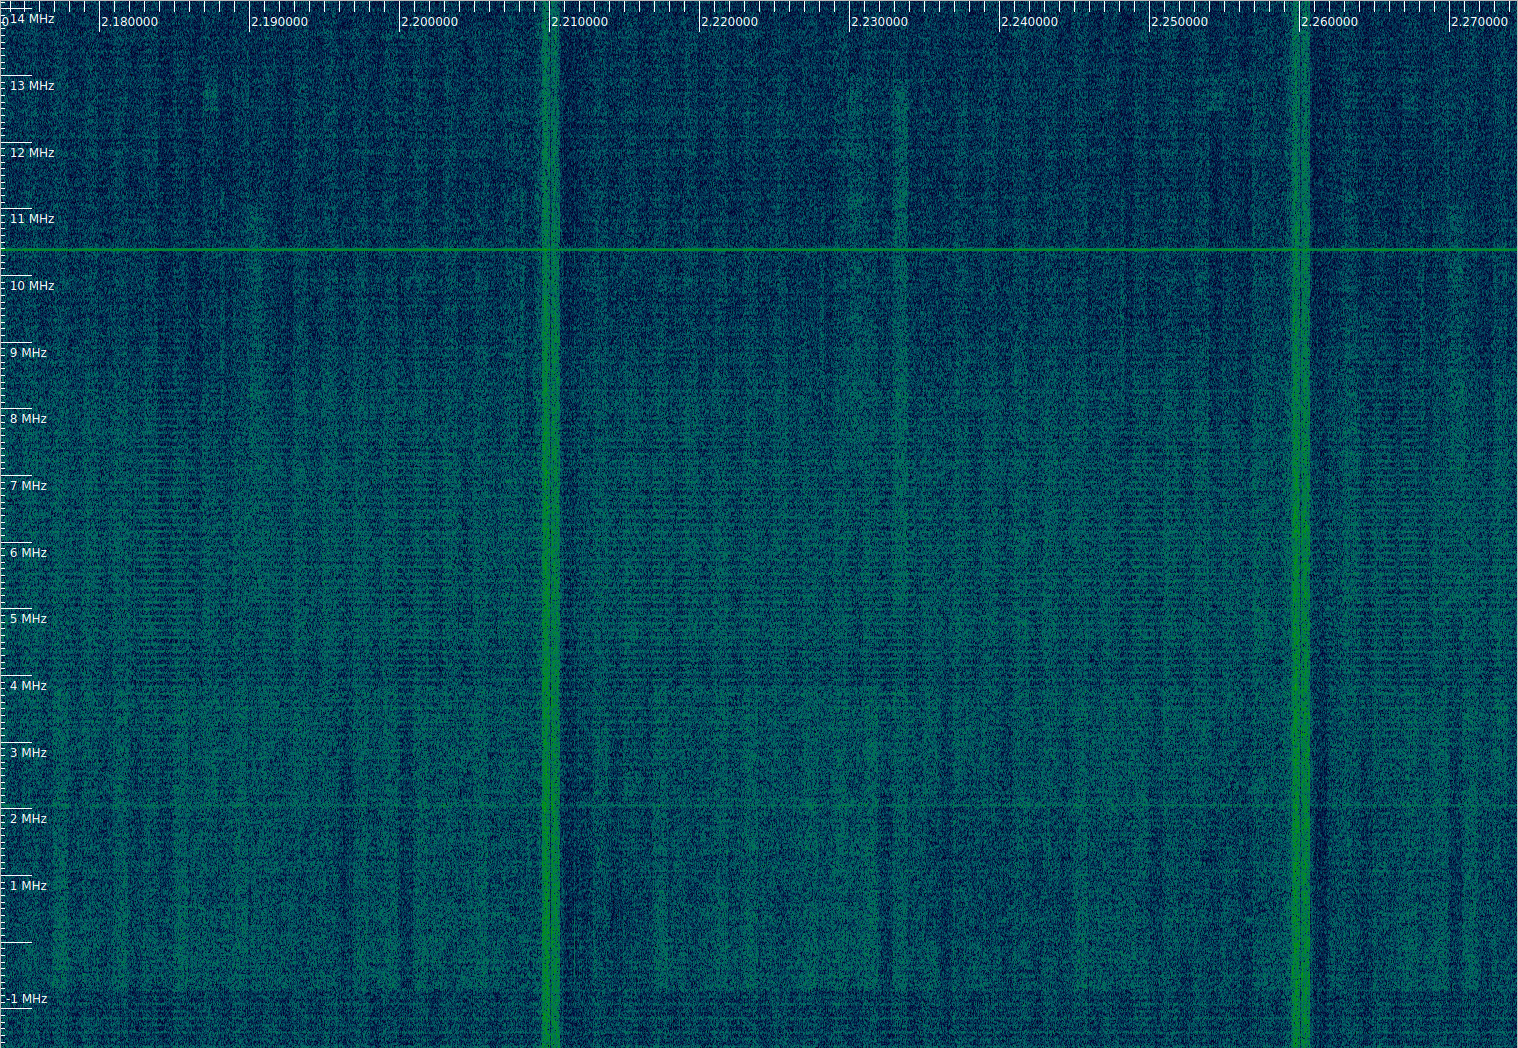
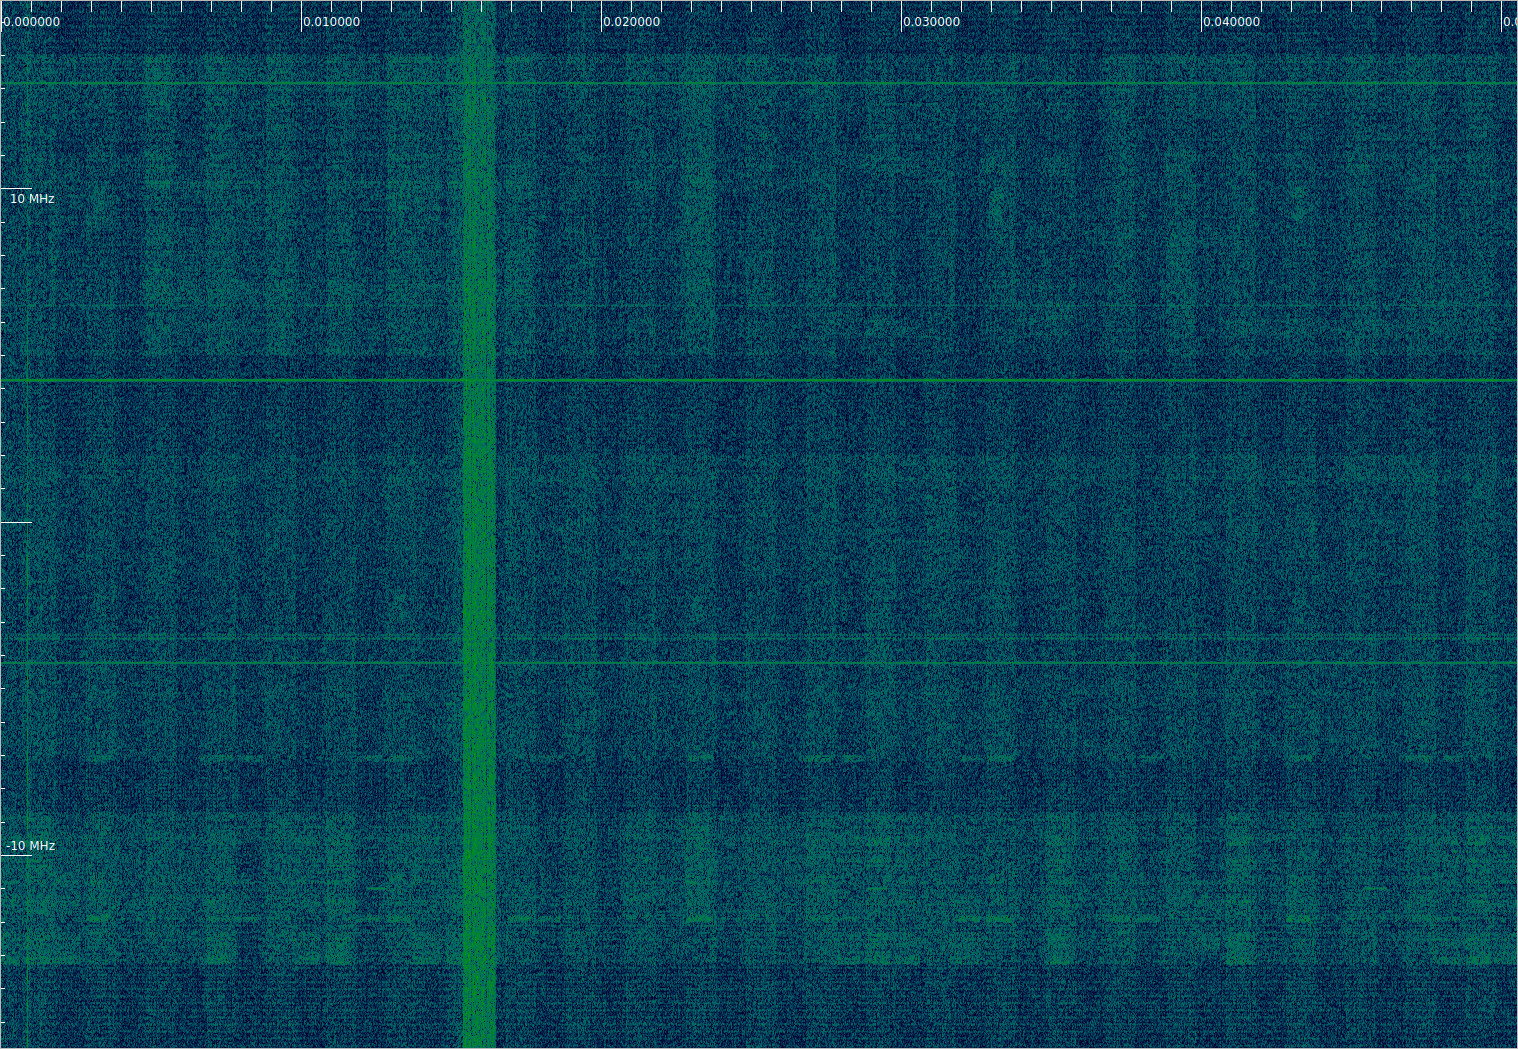
The signals are best seen as a waterfall in Inspectrum. This also shows more clearly that there are spectral lines at intervals of ~200 kHz and wideband bursts every 50 ms. These are present in other recordings and I think they are caused by the Pluto, my phone, or the USB cable.
The signals are in the frequency range for the B71/n71 band (downlink on 617 – 652 MHz), which is used by T-Mobile for LTE “Extended Range” and 5G “Extended Range”. Taking a look at Cellmapper, it seems that the carriers used in this area are a 5 MHz carrier at 624.5 MHz for LTE and a 10 MHz carrier at 632.45 MHz for 5G NR. This matches what we see in the recording.
722.8 – 784.24 MHz
Recording file: 2023-08-03-15-38-39_atarfi.sigmf
This contains three OFDM cellular signals. They are stronger than in the previous recording, and fortunately the interference from the Pluto/phone/USB is much weaker in the part of the spectrum where the signals are present.
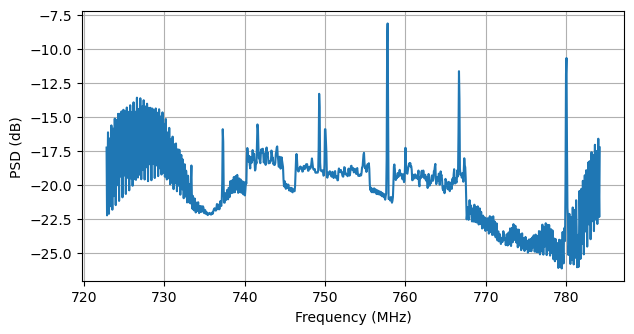
The signals are in the B12/B17 (B17 is actually contained inside B12), B13, and B14 LTE bands. The B12 and B13 bands form a contiguous range from 729 to 756 MHz, and the B14 band covers 758 to 768 MHz (the 2 MHz gap between B13 and B14 explains the larger than usual guardband between two of the signals). Looking at Cellmapper, AT&T uses a 5 MHz carrier at 742.5 MHz and a 10 MHz carrier at 763 MHz, and Verizon uses a 10 MHz carrier at 751 MHz. These are the three signals we see.
It is convenient to note that the cellular base stations closest to Hat Creek Radio Observatory are in Burney (17 km), Fall River Mills (20 km), and the Manzanita Lake entrance to Lassen National Volcanic Park (31 km). There is mountainous terrain around, and cell coverage around the site is generally poor.
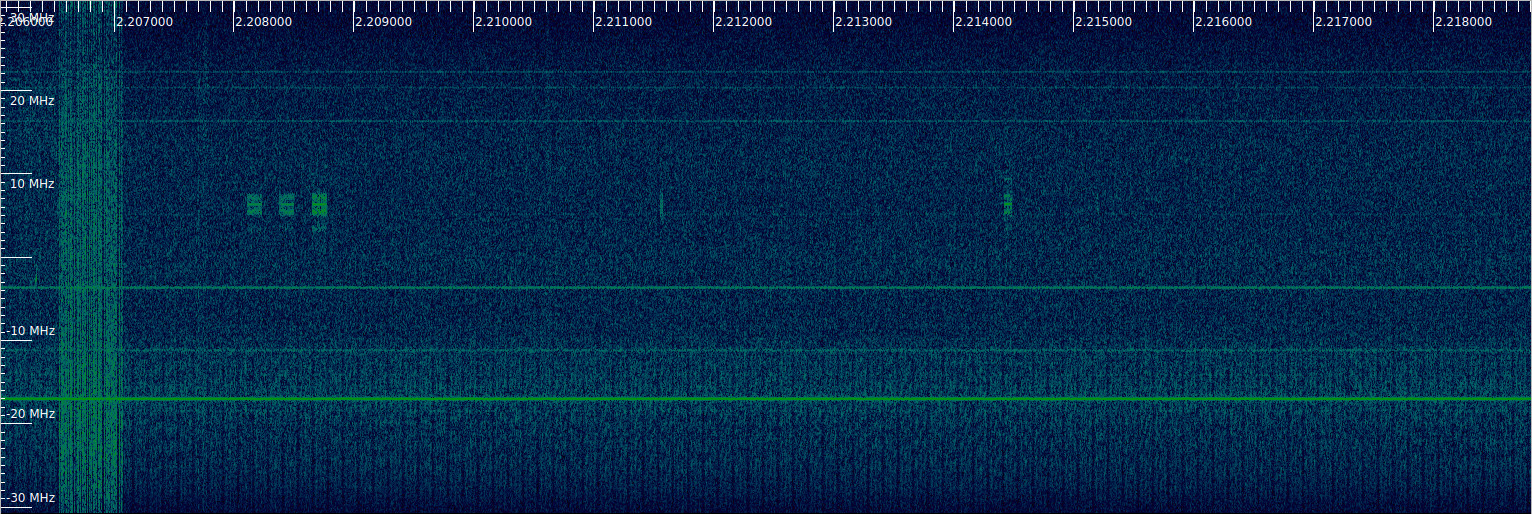
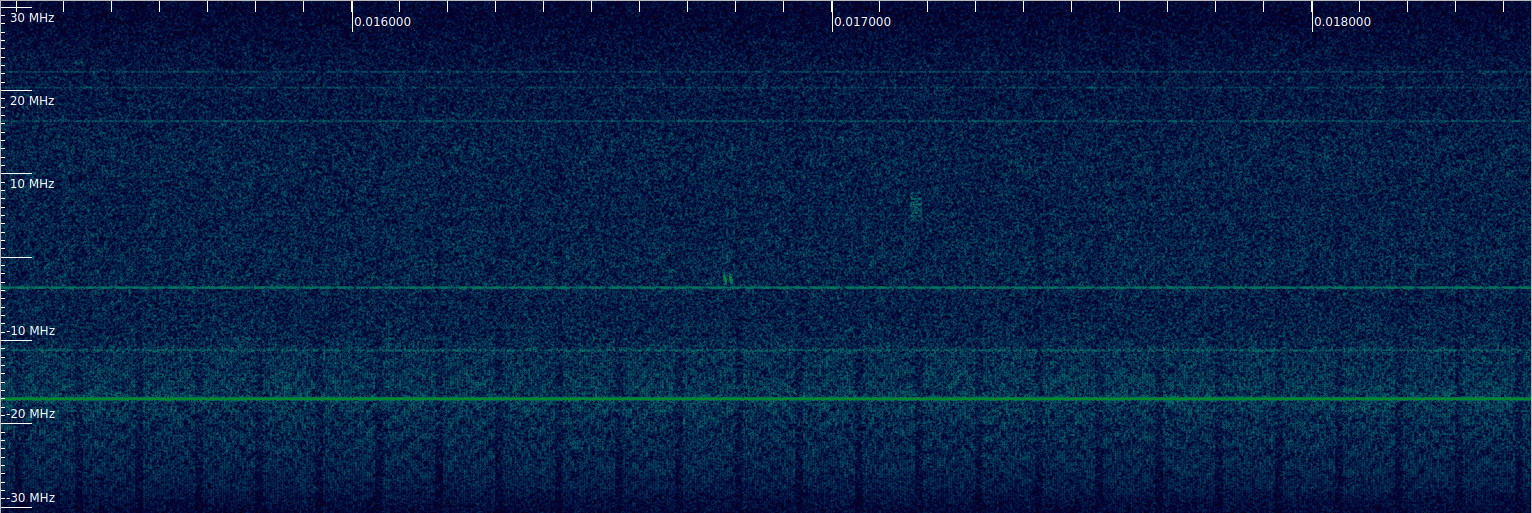
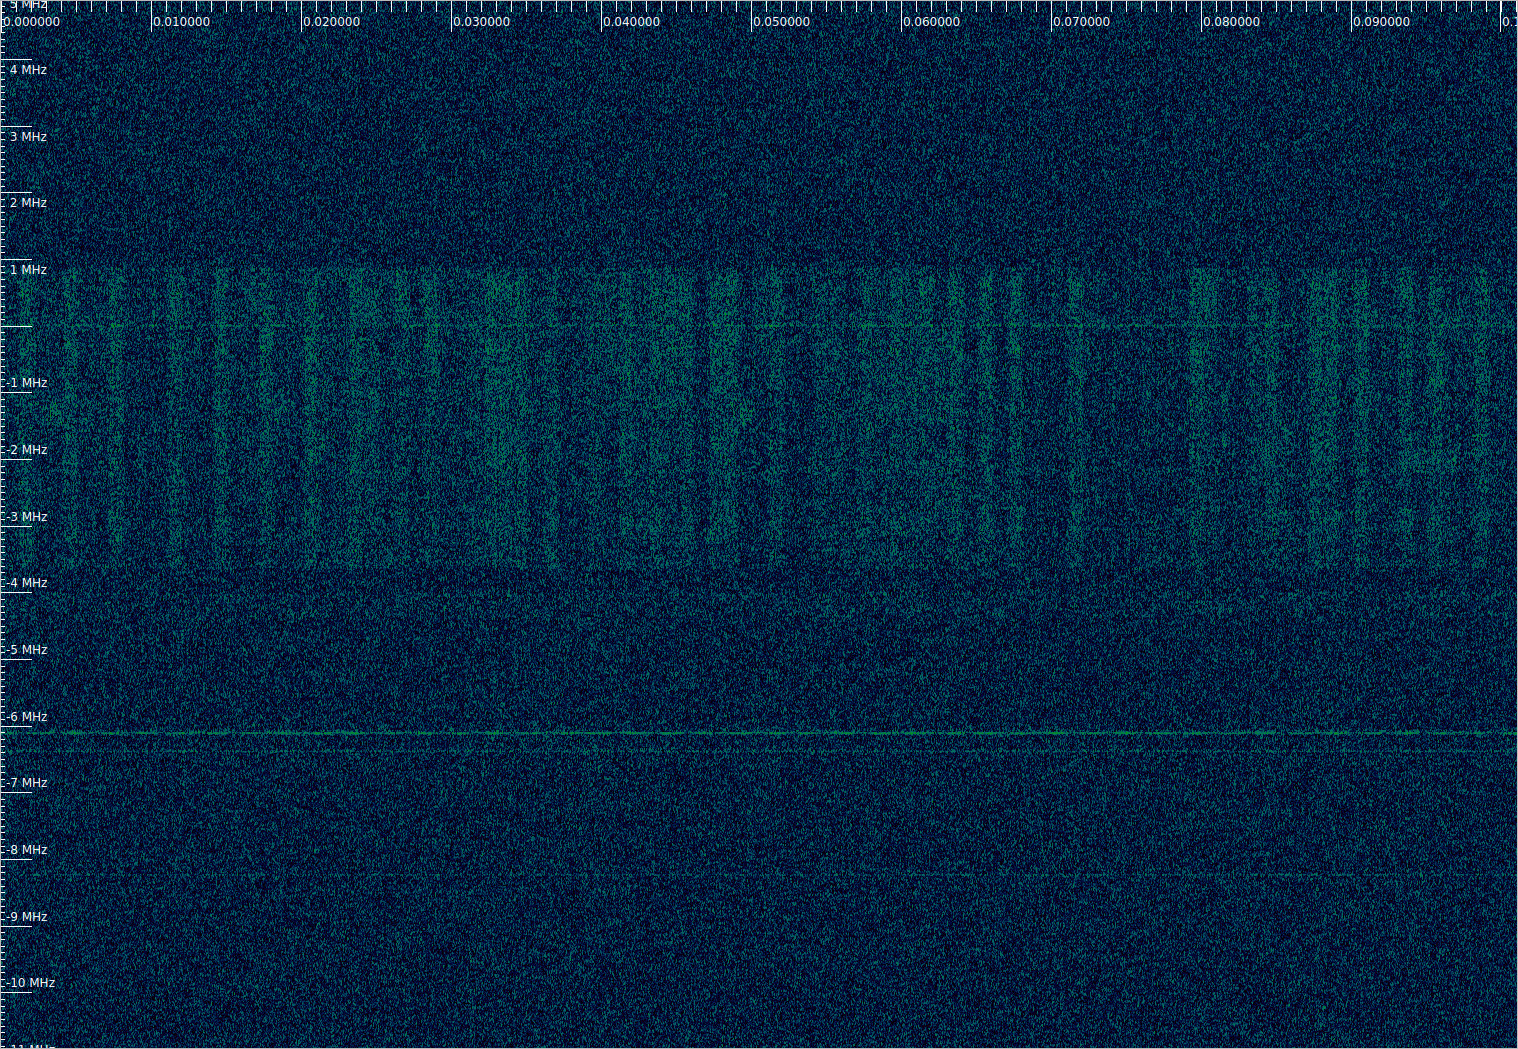
The inspectrum waterfall shows NB-IoT carriers in two of the LTE carriers.
There is also a signal that transmits periodic bursts at 772.25 MHz. Each burst has a duration of 1 ms. The first and second burst are spaced by ~33 ms, and the pattern repeats every 100 ms. I don’t know what this signal is.

1053.04 – 1114.48 MHz
Recording file: 2023-08-03-15-39-57_atarfi.sigmf
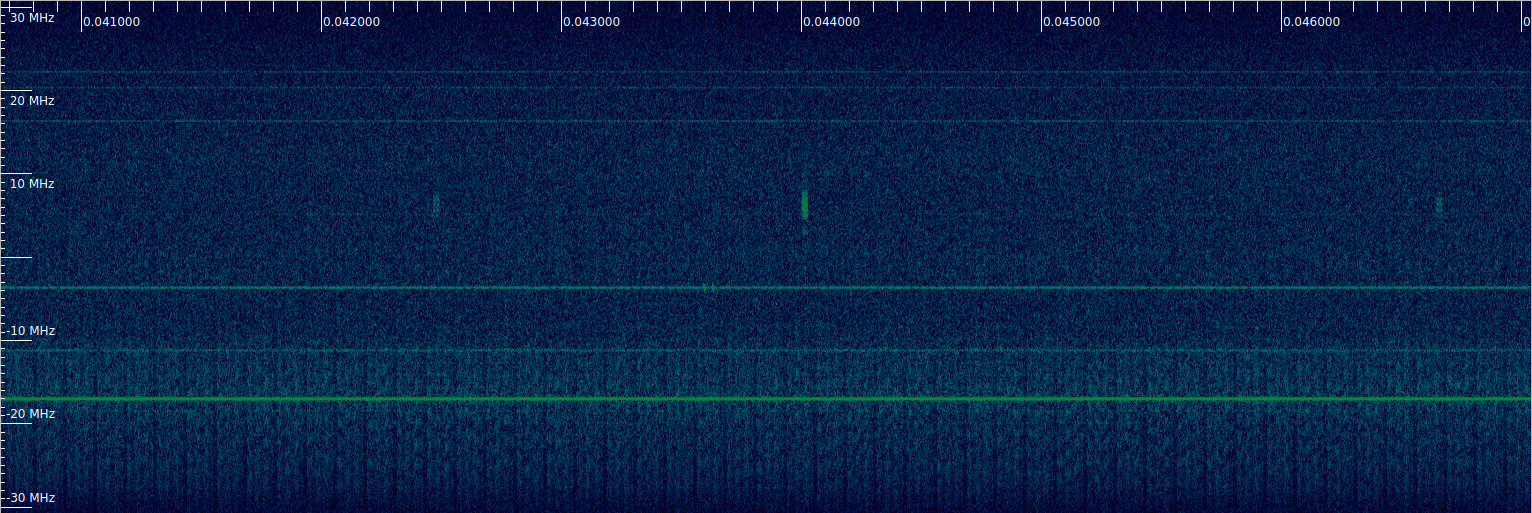
This contains ADS-B beacons from airplanes at 1090 MHz. A few of them can be seen in this waterfall at a baseband frequency of 6.25 MHz.
Besides ADS-B, this frequency range also contains DME pulses transmitted from aircraft (DME pulses transmitted from ground are also in this frequency range, but probably they cannot be received at Hat Creek). A list of DME frequency channels can be found here and here.
DME pulses (actually a DME signal consists of a double pulse) are present at several different frequencies in the recording. One of the most used frequencies is 1081 MHz, with a pulse spacing of 12 usec. This corresponds to DME channel 57X.
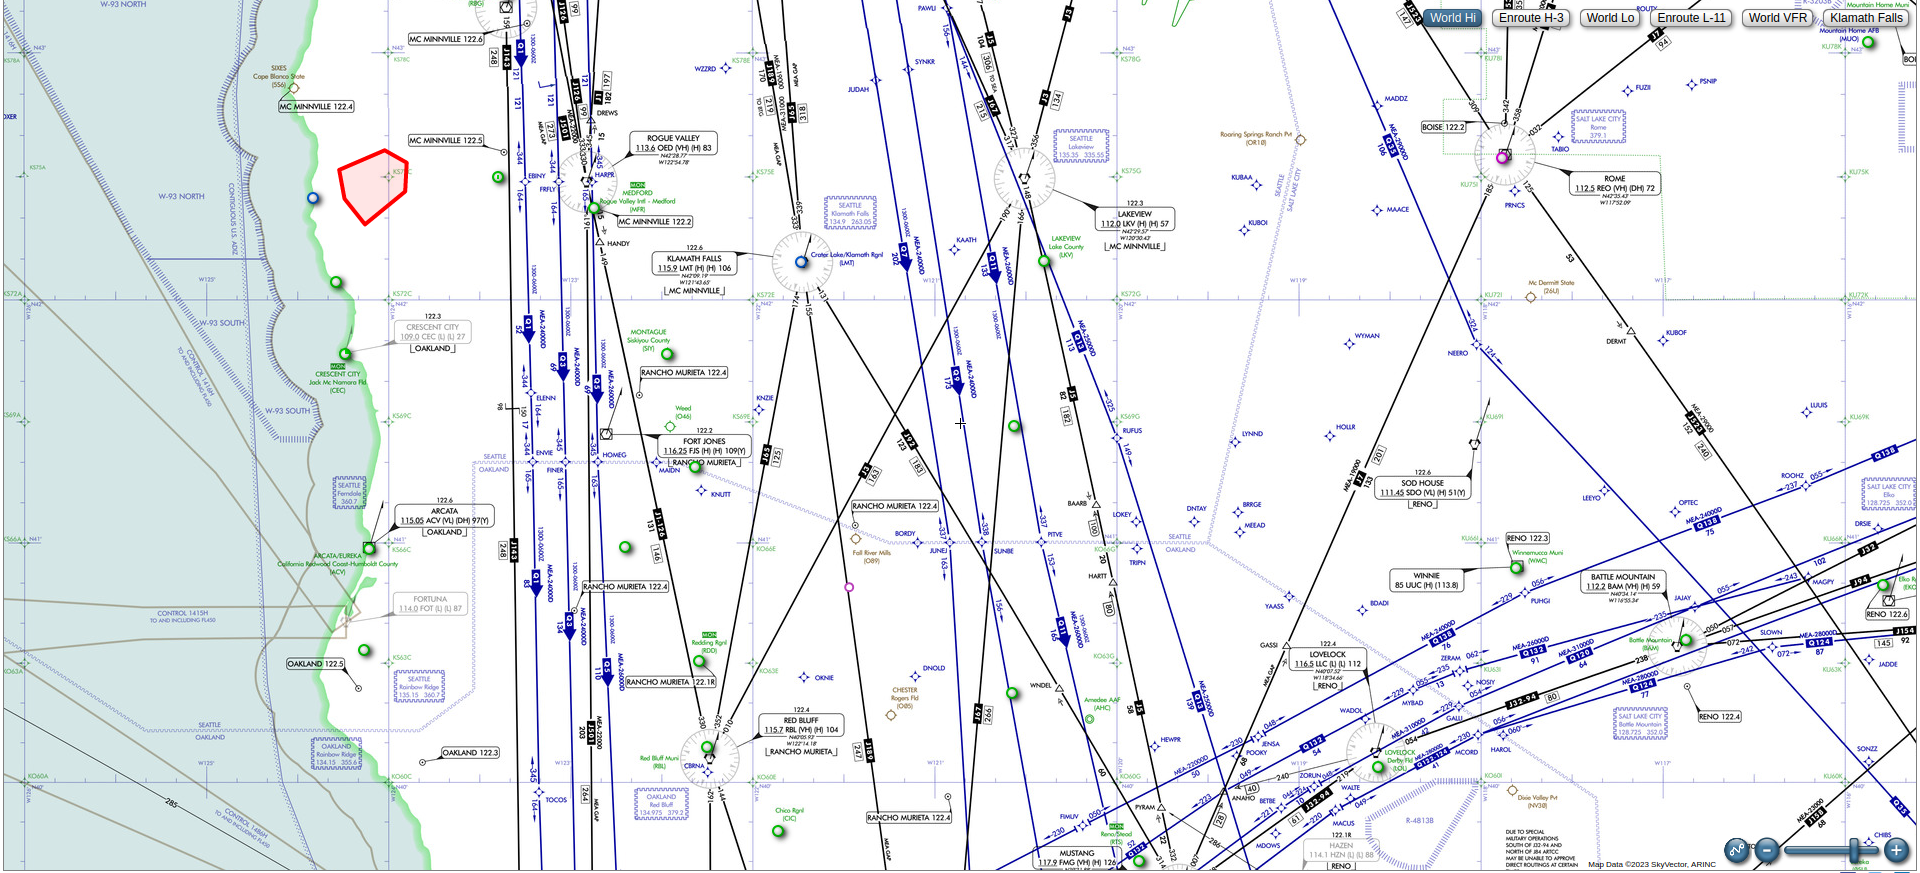
After some searching around, I found that channel 57X is used by the Lakeview (LKV) VORTAC (VORTAC stations include a DME). The following figure shows the World Hi navigation chart around Hat Creek, including the Lakeview VORTAC. The location of Hat Creek Radio Observatory is marked with a pink circle (yes, the site periodically gets RFI from aircraft radar altimeter at 4.3 GHz because of the airplanes flying overhead on the J189 route or similar GPS tracks).
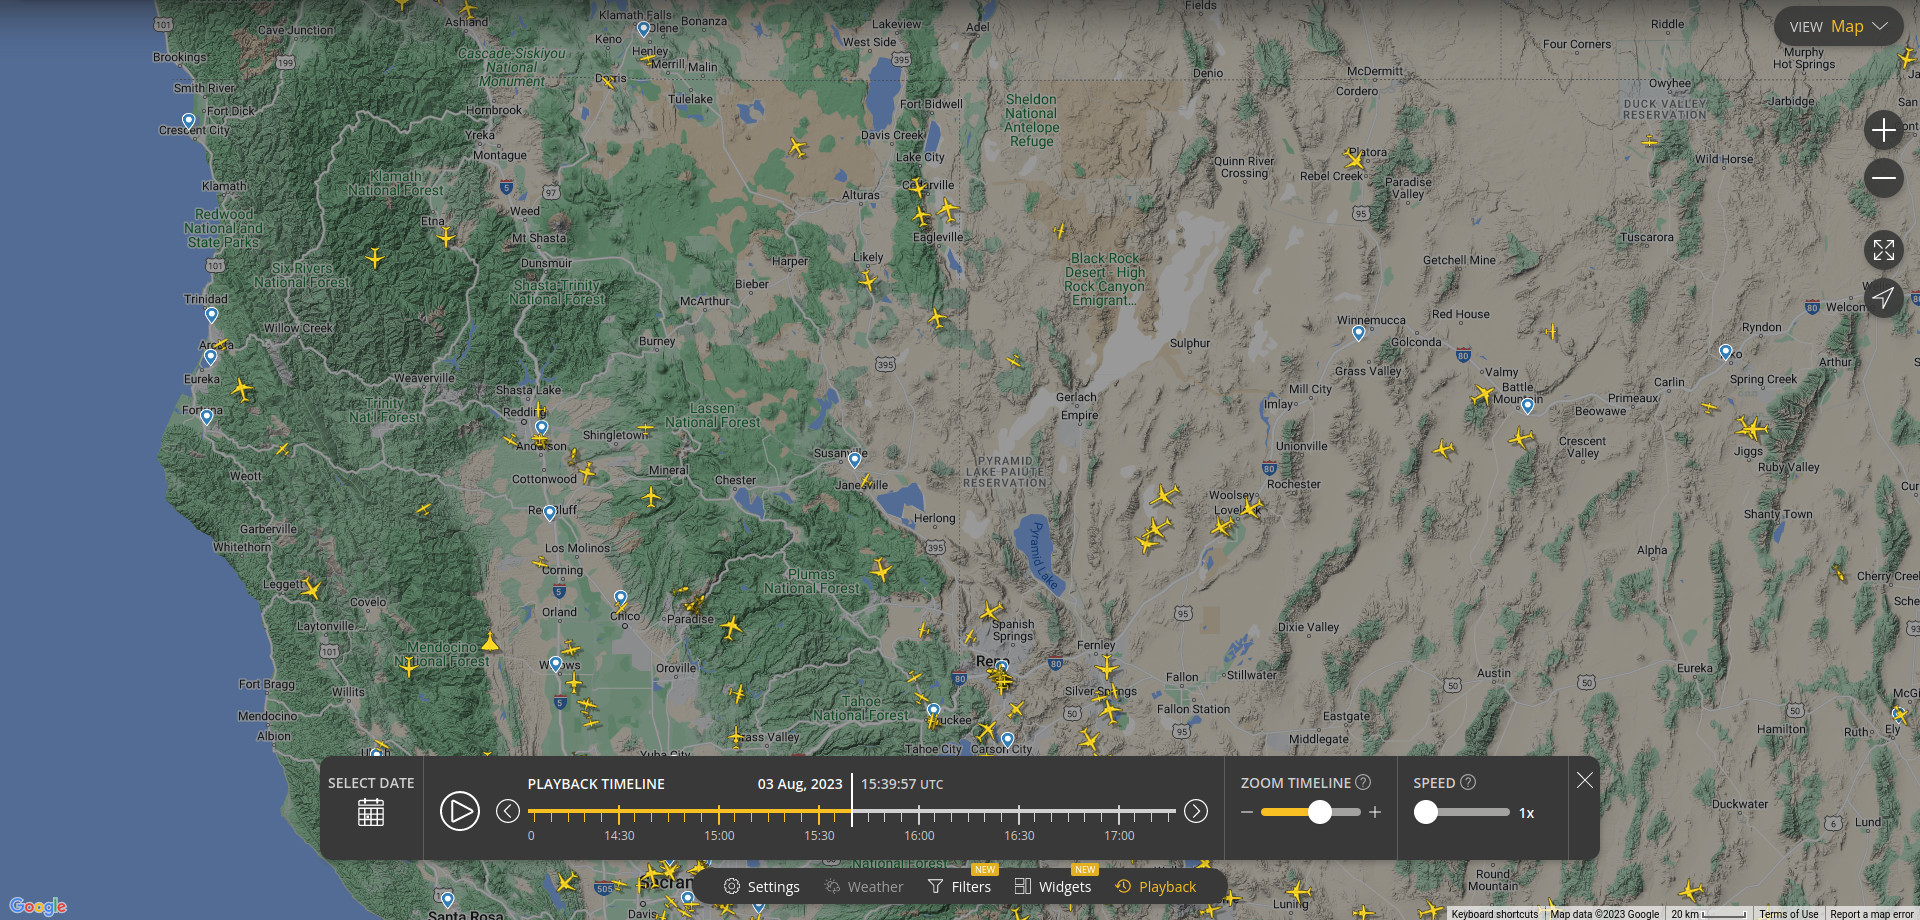
The next image shows the locations of aircraft in Flightradar24‘s database when the recording was done. Hat Creek is roughly between the labels “Burney” and “Lassen National Forest”. Comparing this image with the navigation chart, we see that there are a few airplanes travelling along route J5 between Lakeview and Reno (Mustang VORTAC). Typically, these would be using the Lakeview DME, and transmitting interrogation signals to it. There are several aircraft above Lake City, at around 34000 to 36000 ft. These would be at an elevation of around 4 degrees in the sky at the Allen Telescope Array, and so their signals would be in line-of-sight (the exact elevation mask given by the hills around the valley where the observatory is built would need to be checked).
Another set of DME pulses that has caught my attention are at 1080 MHz. These use a pulse separation of 36 usec, as can be seen in the waterfall below (the pulses are on top of a CW spur). Therefore, they correspond to channel 56Y. This channel is assigned to an ILS with a localizer frequency of 111.95 MHz.
I have looked around in the navigation charts to try to find an airport with this ILS frequency, but haven’t found it. This is somewhat strange, because there are not so many airports with ILS around Hat Creek, and because an airplane on an ILS approach would be flying relatively low, so for its signals to be in line-of-sight it could not be 100 km away from Hat Creek as it was the case with the airplanes travelling on high altitude routes.
There are DME pulses on a few other frequencies in the recording, but I have not looked at those in detail.
1598.32 – 1659.76 MHz
Recording file: 2023-08-03-15-42-42_atarfi.sigmf
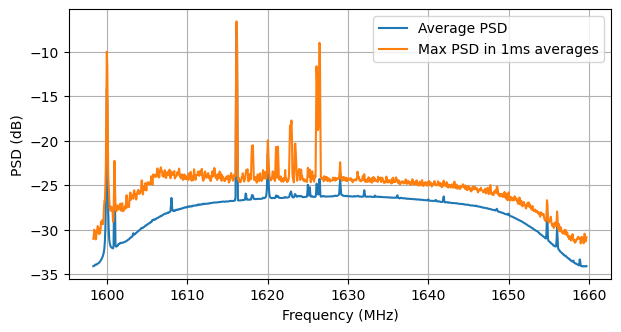
This recording contains narrowband bursts with durations between 8.4 and 20.4 ms, and frequencies between 1618 and 1626.5 MHz. These correspond to Iridium signals. It is not strange that they can be received fairly well with this set up, since Iridium phones have a somewhat better antenna and LNA compared to what I was using, but are otherwise not too different from my equipment.
The Iridium signals are the only L-band satellite signals that I could receive with the Pluto. This means that they are much stronger than other L-band signals such as GNSS and GEOs such as Inmarsat, so they would cause large RFI in L-band observations with the Allen Telescope Array (and in fact we are seeing a lot of RFI on L-band, not only from Iridium, but also from GNSS, Inmarsat, and potentially other satellites).
There are some Iridium bursts at 1626.49 MHz that are particularly strong. The waterfall below shows one of them. Iridium satellites use spot beams, so it is normal that we see signals of very different strengths depending on what beam and satellite each burst is transmitted from.
The next plot shows the power spectral density of the recording, both as an overall average, and as the maximum hold of averages of 1ms, which makes the bursts much easier to see.
1913.2 – 1974.64 MHz
Recording file: 2023-08-03-15-44-34_atarfi.sigmf
This recording contains what looks like a 5 MHz LTE carrier, with an NB-IoT carrier adjacent to it. This frequency range corresponds to the downlink of the B2 (or B25) LTE band, which goes from 1930 MHz to 1990 MHz (or 1995 MHz).
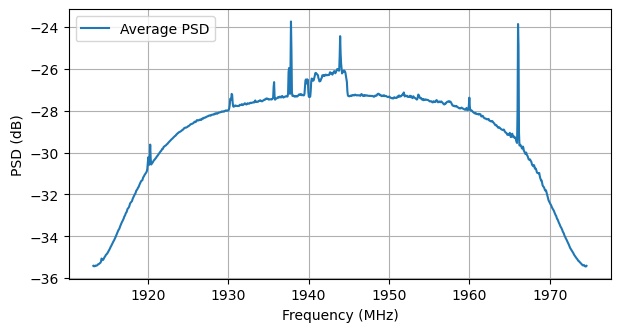
Looking around in Cellmapper, it seems that this signal only matches a Verizon base station at the Lake Manzanita entrance of Lassen National Volcanic Park, which is a 5 MHz cell at 1942.5 MHz. Other base stations for Verizon and other carriers use different frequencies, and are perhaps barely visible around 1955 MHz in the spectrum above. The waterfall of this signal in Inspectrum is shown here.
2304.88 – 2366.32 MHz
Recording file: 2023-08-03-15-46-22_atarfi.sigmf
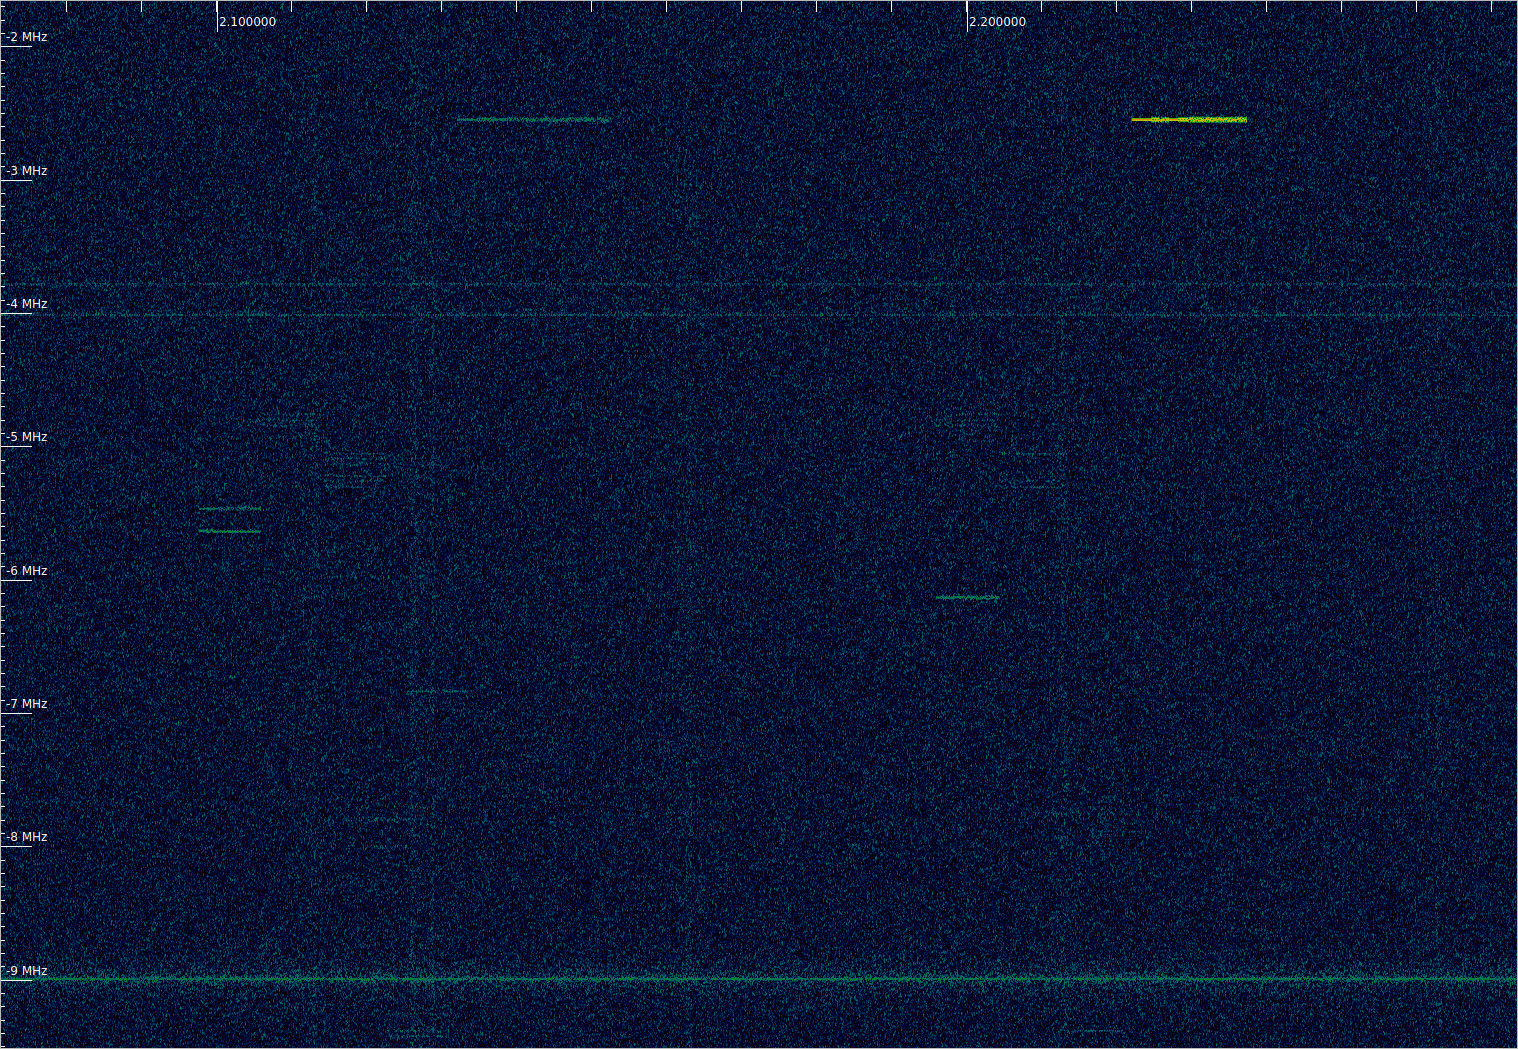
This recording shows relatively strong signals from the SiriusXM satellite radio GEO satellites. As in the case of Iridium, they are engineered to be received with a receiver that is not too far off with the Pluto and bad antenna that I was using for this survey, so it is not surprising that they are strong. They are by far the strongest signal that can usually be received with the ATA dishes, even when pointing away from the satellites.
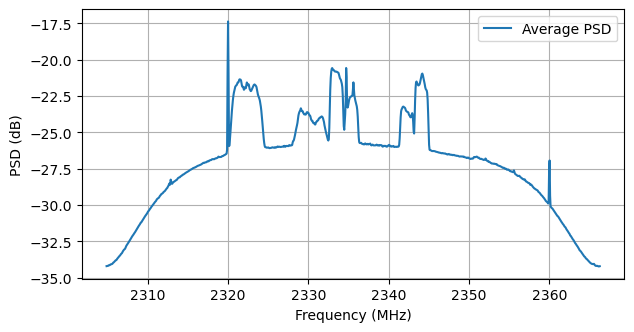
The spectrum of the signals doesn’t look flat, specially for some of them. This suggests some multipath. I was doing the recordings quite close to the main office building, standing besides the western wall of the building. The SiriusXM satellites are east of Hat Creek, and at two different longitudes, so I’m not certain that I had line-of-sight to all of them. Perhaps the signals for the easternmost satellites were diffracting over the building roof or crossing through the windows. In hindsight I should have gone further away from the building to do these recordings.
Conclusions
In this very quick survey we have seen that handheld equipment consisting of an ADALM Pluto, a small antenna and a phone can show us what are the strongest sources of RFI in the Allen Telescope Array. These are, as we already knew or expected, cellular phone base station signals (albeit on the borderline of their coverage), aircraft signals, and some satellite signals which are very strong because they are intended to be received with small antennas.
Luckily, we have seen no signals from cellphones, wifi, Bluetooth or microwaves, not surprisingly, because all of these expect for the microwaves are forbidden on-site (there is a microwave in the office building which rarely gets used, and microwaves at the houses, 1 km away without line-of-sight). No signals were detected between 2.4 and 6 GHz. This is to be expected, since I don’t know of very strong signals in this range (except for the 4.3 GHz altimeter radar when an airplane is flying overhead), and the antenna I was using was very poor at these frequencies.
Tried accessing Zenodo and got:
Permission required
You do not have sufficient permissions to view this page.
Actually more after SigMF spec for 12-bit recordings. Have you saved it under cs16 format? They said that custom widths are not supported by the spec: https://github.com/sigmf/SigMF/issues/3
Thanks! I just fixed the Zenodo links.
Regarding the 12-bit recording, the data is recorded packed as 3 bytes per IQ sample (24 bits) to the Pluto DDR and it is then unpacked to cs16 format on the fly when the SigMF recording is downloaded. The SigMF recording datatype is indeed ci16_le.
Nice to stumble across this work. Have you looked at the RFI measurements memo done by Geoff Bower? I don’t see it in the seti.org memo series…
The RFI measurement is referenced here (https://www.ursi.org/proceedings/procGA02/papers/p1966.pdf), but I vaguely remember another memo that focused on the complete measurement run and among other sources seen were airport radar bounces off of Mt Shasta and Mt Lassen.
Hi Colby. Thanks for the reference. I hadn’t seen this. The related work about RFI cancellation of GNSS satellites that he did looks quite interesting. It seems that Geoff’s survey was done ~20 years ago. I wonder how things have changed since then. I guess that there are way many more satellites active, and probably also more cell base stations.