In my previous post, I talked about an observation of Chang’e 5 made with Allen Telescope Array last Sunday, 2020-11-29. I still need to write the report corresponding to the observation from Saturday 2020-11-28. However, before doing so, I thought it would be interesting to look at the polarization of each of the signals in these recordings. As I already advanced, the polarization is not perfect RHCP, but rather elliptical and time varying.
In fact, it seems likely that most of the antennas of Chang’e 5 are not steerable antennas, but rather, patch-like medium-gain or low-gain antennas. These are circularly-polarized only when seen from the front. They are linearly polarized when seen from a side.
Therefore, by studying the polarization of the Chang’e X-band signals, we can try to learn more about the spacecraft’s attitude and its antennas.
The recordings were made with antenna 1h, which has one of the new cryo-cooled feeds. The feed has linear polarizations X (horizontal) and Y (vertical). Both polarizations were recorded simultaneously with the two channels of a USRP N321 using LO sharing, so the only instrumental effects to correct for are the gain and phase offset between channels. We assume that these are constant throughout the observation.
The spectra and cross-spectra of the IQ recordings are computed with the ce5_xy.grc GNU Radio flowgraph for the recording done on 2020-11-28 and with ce5_240k_crossspectrum.grc for the recording done one 2020-11-29 (the sample rate of the recordings is different).
The gain offset is computed by first estimating the noise level in the X and Y channels by taking the median along the frequency axis, and then computing the average of the quotient between the noise in the X channel and the noise in the Y channel. The phase offset between the X and Y channels comes from an observation of the RHCP signal of Tianwen-1 done on 2020-11-01. In this recording, the offset between the X and Y channels was -160 degrees.
Transporting the phase offset calibration from Tianwen-1 to Chang’e 5 is not perfect, because Tianwen-1’s frequency is some 30 to 50 MHz lower than the Chang’e 5 signals, and the recording was done a while ago. However, recordings from other deep-space X-band signals such as MRO done other weekends have shown a similar phase offset around -150 degrees.
Once the spectra and cross-spectra are corrected for instrumental effects, the Stokes parameters are computed and plotted. Only a few frequency bins about the strongest peak are used for the calculation, in order to take the strong residual carrier of the signal and leave out most of the noise.
2020-11-28
The recording from 2020-11-28 was done several hours before LOI-1, the burn that inserted the spacecraft in an elliptical lunar orbit. Therefore, the spacecraft was still ariving to the Moon. The antenna was aimed by hand to peak on the signal, since accurate ephemerides were not available, and then left to track a constant right ascension and declination for approximately one hour and 30 minutes. During this observation the Moon was descending on the sky. Only the strongest signal, at 8463.7 MHz was recorded. The plots and calculations for this observation can be found in this Jupyter notebook.
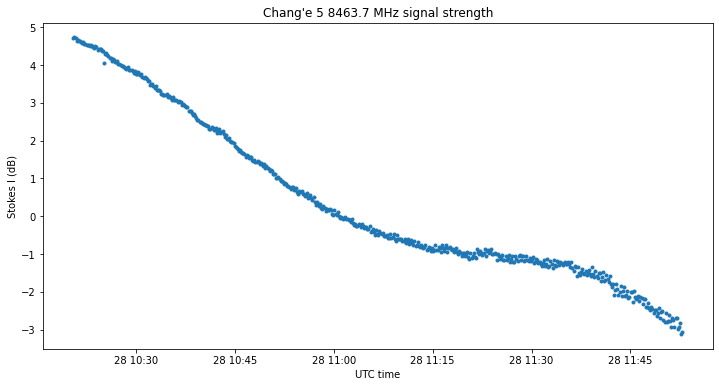
The figure below shows the strength of the signal in dB. The progressive decrease in intensity of some 8dB can be explained by both the spacecraft slowly going out of the dish beam and higher atmospheric attenuation as the elevation decreases.
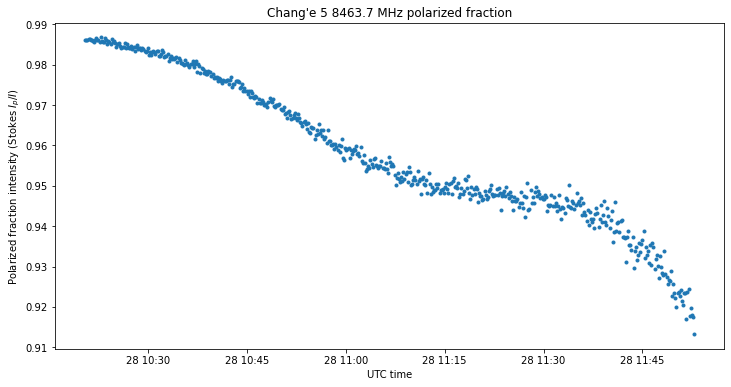
The next figure shows the polarized fraction, or Stokes \(P = \sqrt{Q^2 + U^2 + V^2}\) divided by Stokes \(I\). As the SNR becomes weaker, we have more unpolarized noise that degrades the measurement. However, the SNR is still quite good for us to obtain accurate results.
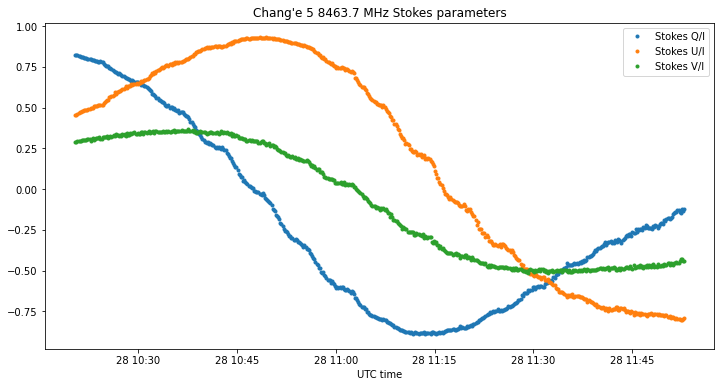
The figure below shows the Stokes parameters \(Q\), \(U\) and \(V\). The three describe sinusoids. The parameters \(Q\) and \(U\) have the same amplitude and are in quadrature, which means that the linear polarization fraction is constant and the polarization angle changes linearly with time. The \(V\) parameter, which gives the circular polarization has less amplitude.
Below we see the linear polarization parameters, which are described via Stokes \(L = Q + iU\). The linear polarization fraction \(|L|/I\) is almost constant and close to one, while the polarization angle \(\operatorname{arg}(L)/2\) increases linearly with time, rotating some 120 degrees throughout the whole observation.
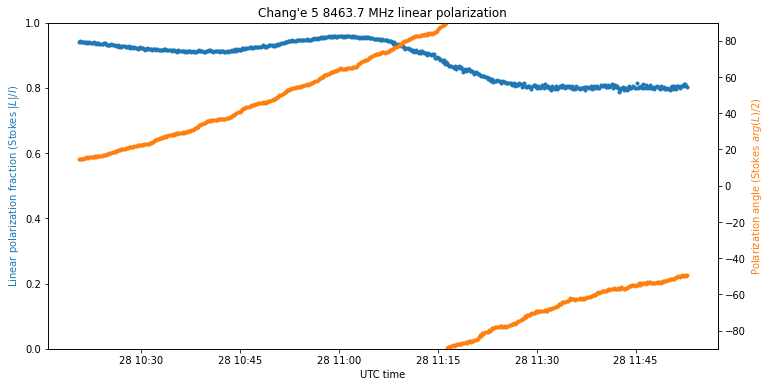
The polarization data seems to indicate that we are seeing a patch-like antenna from the side, so it gives nearly linear polarization. The polarization angle changes linearly with time, which suggests that the spacecraft is rotating slowly, perhaps to distribute heat evenly. The parallactic angle rotation throughout the observation is only of a couple degrees and can be ignored.
There is a small amount of circular polarization, that changes between RHCP and LHCP. This is to be expected, since the antenna is not going to be perfectly linear when seen from the side, and we are probably not exactly aligned with the antenna side either.
2020-11-29
The observation done on 2020-11-29 was described in the previous post. The four low rate X-band telemetry signals of the spacecraft were simultaneously recorded before and during LOI-2, which was the burn that circularized the elliptical lunar orbit. During the observation, the spacecraft is travelling towards the periapsis, and then performing the retrograde burn. The plots and calculations for this observation can be found in this Jupyter notebook.
The figure below, taken from the previous post, shows the Doppler of each of the four signals using different colours for each signal. The plots below will use the same colour coding.
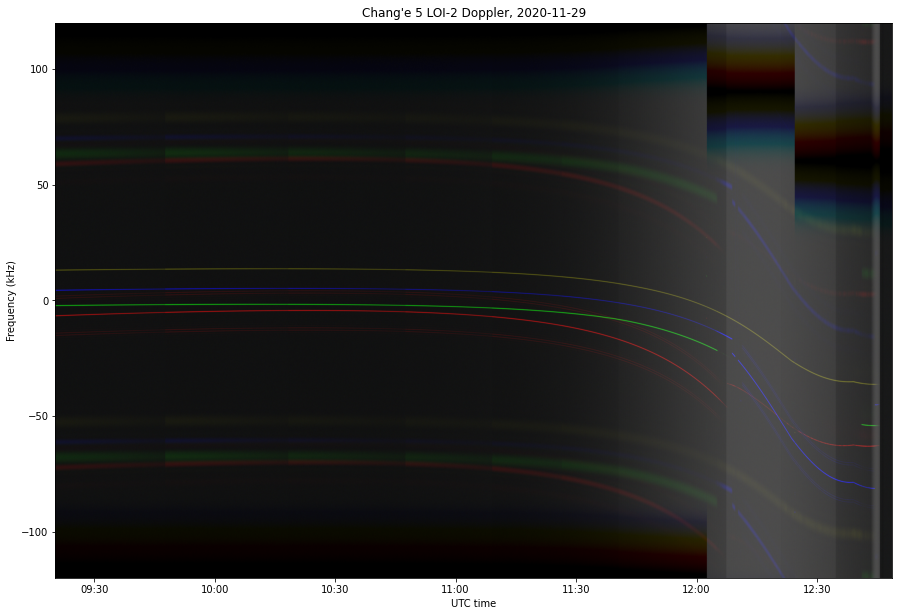
The figure below shows the strength (Stokes \(I\)) of each of the signals. This gives a quantitative view of what we could already see in the waterfall above. The dish was hand-tracked by using some ephemerides provided by Scott Tilley VE7TIL, and changing the right-ascension and declination by hand every 10 or 20 minutes. This is apparent by the the steady decrease in signal strength until I move the dish to the new position.
The small waves are caused by scalloping loss in the FFT. With these recordings I used a rectangular window, while with the recording from 2020-11-28 I used a Blackman-harris window. In hindsight, the rectangular window is probably not the best idea, but we are not very concerned, since we will be normalizing by dividing by Stokes \(I\).

There are five distinct parts in this graph. The first part lasts until shortly after 12:00 UTC. Here the spacecraft is coasting in its elliptical orbit, and the signal strength doesn’t change much, other than the effects of dish pointing. The red and green signals are the strongest during this part.
The second part corresponds to the spacecraft changing attitude to prepare for the retrograde burn. As we already saw in the waterfall, the green signal disappears in the noise, the red signal becomes much weaker, and now the blue and yellow signals become the strongest. This seems to indicate that the spacecraft has made a large attitude change and now we are probably seeing another side of its body (maybe even the opposite side).
The third part corresponds to the burn itself. This is characterized by very noisy signal strength curves. This was a bit unexpected to me, but it’s also quite logical. As the spacecraft and its antennas rattle during the burn, this causes an amplitude modulation that we can see in the signal strength data. So not only we can detect the burn by looking at the Doppler, but also at other properties of the signal.
Probably we can also see the rattle as phase modulation in the carrier. It would be interesting to study the frequency scale characteristics of the amplitude and phase modulation of the carrier during the burn, since here we are doing integrations of 10 seconds to measure the amplitude.
During the burn we see that the strength of the red signal increases quickly, while the blue signal decreases. Most likely the spacecraft is controlling its attitude to always burn in the direction opposite to the velocity vector. As the velocity vector swings by with the periapsis passage, the spacecraft also changes its attitude significantly, and this is what we see here.
The fourth phase is brief and not so easy to see in the plot above. The burn stops and the green signal comes back on. The yellow signal loses a few dB, and the blue and red signal more or less maintain their level. This means that the spacecraft is changing its attitude again after the burn. The curves are still noisy, so probably the spacecraft is still rotating.
The last phase corresponds to the loss of signal as the Moon went below the minimum tracking elevation of 16.8 degrees.
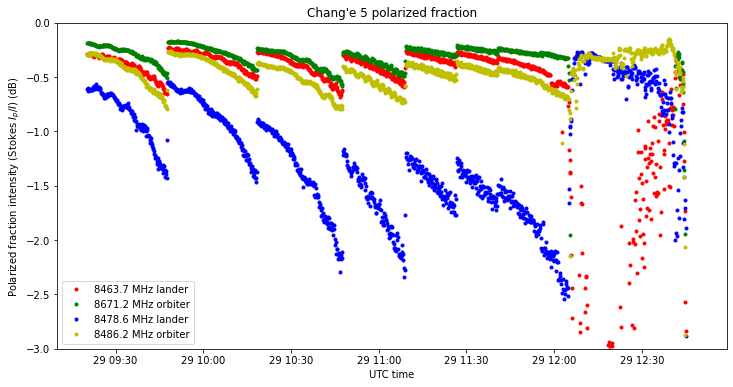
The plot of the polarized fraction shows that we can do good measurements of the four signals, except when the green signal disappears during LOI-2, and perhaps for the red signal during the beginning of LOI-2.
The next figure shows Stokes \(V/I\), which indicates the fraction of circular polarization. This is positive for RHCP and negative for LHCP. We see that during the coast phase the red and green signals have a good degree of RHCP. This makes sense, because the antennas are nominally RHCP, and these are the strongest signals. The blue signal is not very circular, so probably the antenna is seen from one side, which can also explain why it’s weaker than the others.
When the spacecraft changes attitude for LOI-2, the blue signal becomes very RHCP, while the red signal becomes slightly LHCP. This, together with the change in intensity, explains why the tracking groundstation drops the lock of the red signal and locks the blue signal.
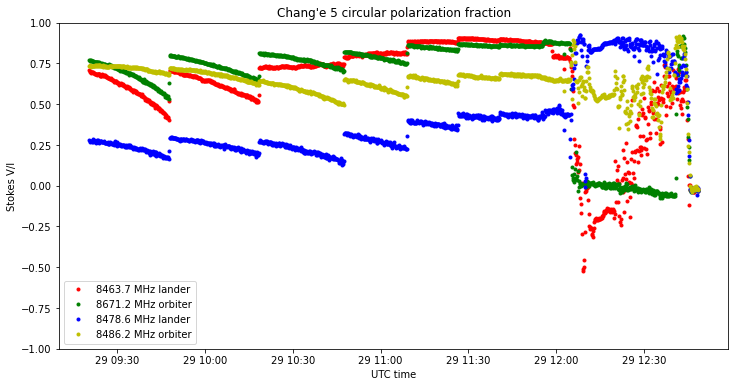
When interpreting these plots keep in mind that the pointing of the dish is not perfect, especially just before each pointing update. Therefore, we are seeing the spacecraft off-axis, so the polarization calibration is not so good as for an on-axis pointing.
The figure below shows the fraction of linear polarization, computed as Stokes \(|L|/I\).

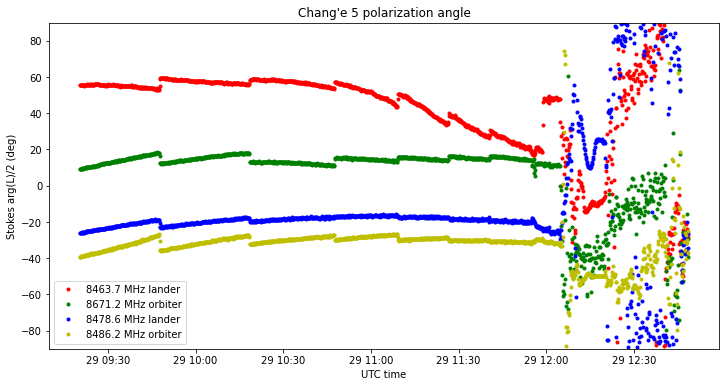
Finally, the figure below shows the polarization angle. The parallactic angle rotation during the whole observation was only around 5 degrees and can be ignored. We see that during the coast phase the angle of most of the signals doesn’t change much, in contrast to the observation made the previous day. As the spacecraft rotates to prepare LOI-2, we can clearly see the rotation in the red and blue signals, and we can even see what looks like some overshoot in the ADCS.
6 comments