Yesterday we had a strong storm in Madrid at around 16:30 UTC. The storm was rather short but intense. Seeing the heavy rain, it occurred to me that I might be able to receive the 10 GHz beacon ED4YAE at Alto del León using my QO-100 groundstation (without moving the antenna).
The 10 GHz beacon is 39.4 km away and the direct path to my station is obstructed by some hill in the middle, as shown in the link profile.

In the countryside just outside town it is possible to receive the beacon, probably because it diffracts on the hills. However, it is impossible for me to receive it directly from home, as there are too many tall buildings in the way.
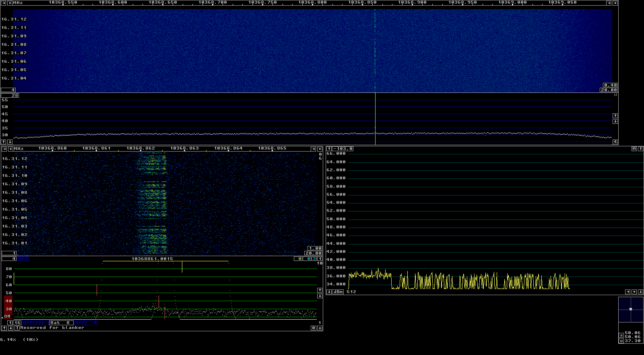
In fact, when I fired up my receiver as the storm raged, I was able to see the beacon signal, with a huge Doppler spread of some 700 Hz (20 m/s). The CW ID of the beacon was easy to copy.

Then I started recording the signal. As the rain got weaker, it started disappearing, until it faded away completely. This post is a short analysis of the scatter geometry and the recording.
Something important about rain scatter with a satellite ground station is that the antenna is aimed at a relatively high elevation, so not much rain volume is present in the antenna beam, in comparison with a terrestrial antenna that might have several tens of km of rain inside its beam.
To compute the scatter volume, we must know the top height of the rain, which is the height at which rain stops. It is not so easy to estimate this value, but we can do a rough estimate by looking at the altitude of the cloud layers in a METAR report from an airport. The METAR from Madrid Barajas airport corresponding to the storm was the following:
LEMD 051630Z 12003KT 7000 3000N VCSH SCT020CB BKN050 21/12 Q1022 TEMPO 3000 TSRA SCT030CB
This gives a layer at 2000 ft formed by scattered cumulonimbus and a broken ceiling at 5000 ft. I have decided to take 5000 ft (which is 1524 m) as the top of the rain. However, I would not be surprised if the top of the rain was half of this value, which would reduce the scatter volume.
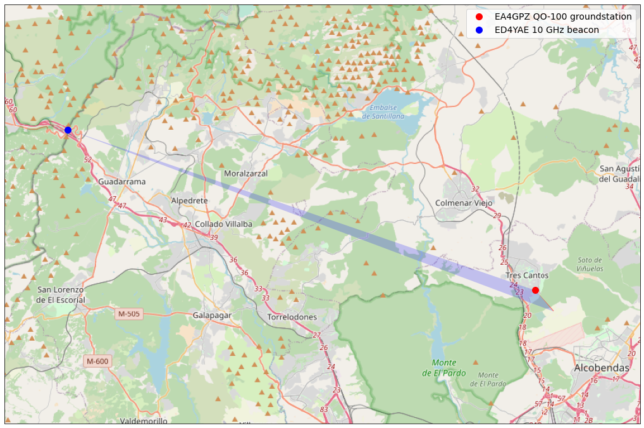
My QO-100 antenna, which is a 1.2 metre offset dish is aimed at an elevation of 34.1 deg. This gives us a slant distance of only 2.7 km until the beam exits the rain volume. Moreover, the antenna beamwidth is rather narrow. The 3 dB half-beamwidth is only 0.88 deg. Using these values, we can compute and plot the scatter volume.
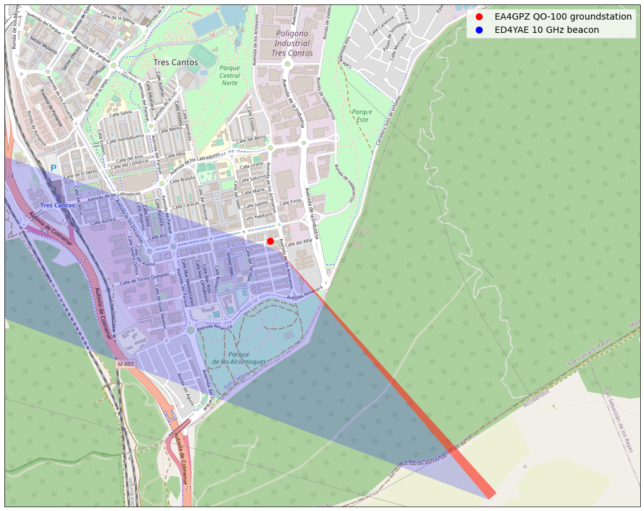
The geometry is shown in the figure below. The path from the beacon to the scatter volume is shown in blue, and the scatter volume is shown in red.

It is easy to see the geometry in this zoomed plot. We see that the beam of the QO-100 dish points south east, and the signal from the beacon arrives roughly from the north east. The scattering angle is 135 degrees.

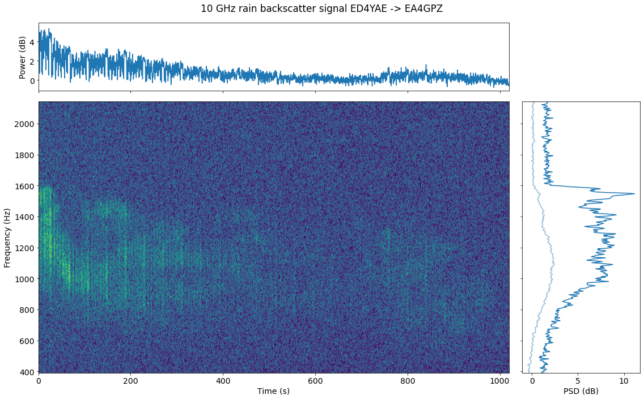
The waterfall of the received signal is shown below. At the start of the recording, when the rain was stronger, we have up to 5 dB of S/N. Then we can see the power dropping and the Doppler spread pattern changing significantly as the storm diminishes.

The frequency axis shows Hz above 10368.861 MHz. The right panel shows some form of max-hold PSD, and also the average PSD, which is rather weak because of the signal fading away.
The recording can be downloaded here. The plots in this post were done in this Jupyter notebook.
Update 21:00 UTC. Something relevant that only now came to mind is the polarization. The beacon uses horizontal polarization, while I did the reception using vertical polarization (which is what is used for the QO-100 NB transponder). However, the LNB is skewed by approximately 30 degrees, so the polarization mismatch would only be 60 degrees, giving 6 dB of losses. I don’t know the amount of depolarization caused by rain scatter, so it will be interesting to repeat this experiment and toggle the receiver between vertical and horizontal polarization.
One comment