Back in August, I posted about my calculations of the site where DSLWP-B impacted with the lunar surface on July 31. The goal was to pass the results of these calculations to the Lunar Reconnaissance Orbiter Camera team so that they could image the location and try to find the impact crater.
Yesterday, the LROC team published a post saying that they had been able to find the crash site in an image taken by the LRO NAC camera on October 5. The impact crater is only 328 metres away from the location I had estimated.
This is amazing, as in some way it represents the definitive end of the DSLWP-B mission (besides all the science data we still need to process) and it validates the accuracy of the calculations we did to locate the crash site. I feel that I should give due credit to all the people involved in the location of the impact.
Wei Mingchuan BG2BHC from Harbin Institute of Technology was the first to take the orbital information from the Chinese Deep Space Network, perform orbit propagation and compute the crash location assuming a spherical Moon, thus obtaining an approximate position in Van Gent X crater. Cees Bassa from ASTRON refined Wei’s calculations by including a digital elevation model. Phil Stooke from Western University first suggested to use a digital elevation model, helped us contact the LROC team, and filled in an observation request for the camera. And of course the LROC team and the Chinese DSN, since the quality of their ephemeris for DSLWP-B allowed us to make a rather precise estimate.
The LROC team has posted the images shown below, where in a comparison between an image taken in 2014 and the image taken in October the small crater can be seen.
The image of the crash is M1324916226L, an image taken by the left NAC camera. However, I can’t find this image yet in the LROC archive, so it seems this image hasn’t been made public yet.
The small crater, which the LROC team estimate to be 4×5 metres in diameter, is visible more clearly if we compute the difference between the before and after images (an idea of Phil Stooke). The figures below show this difference both as a signed quantity and as an absolute value.
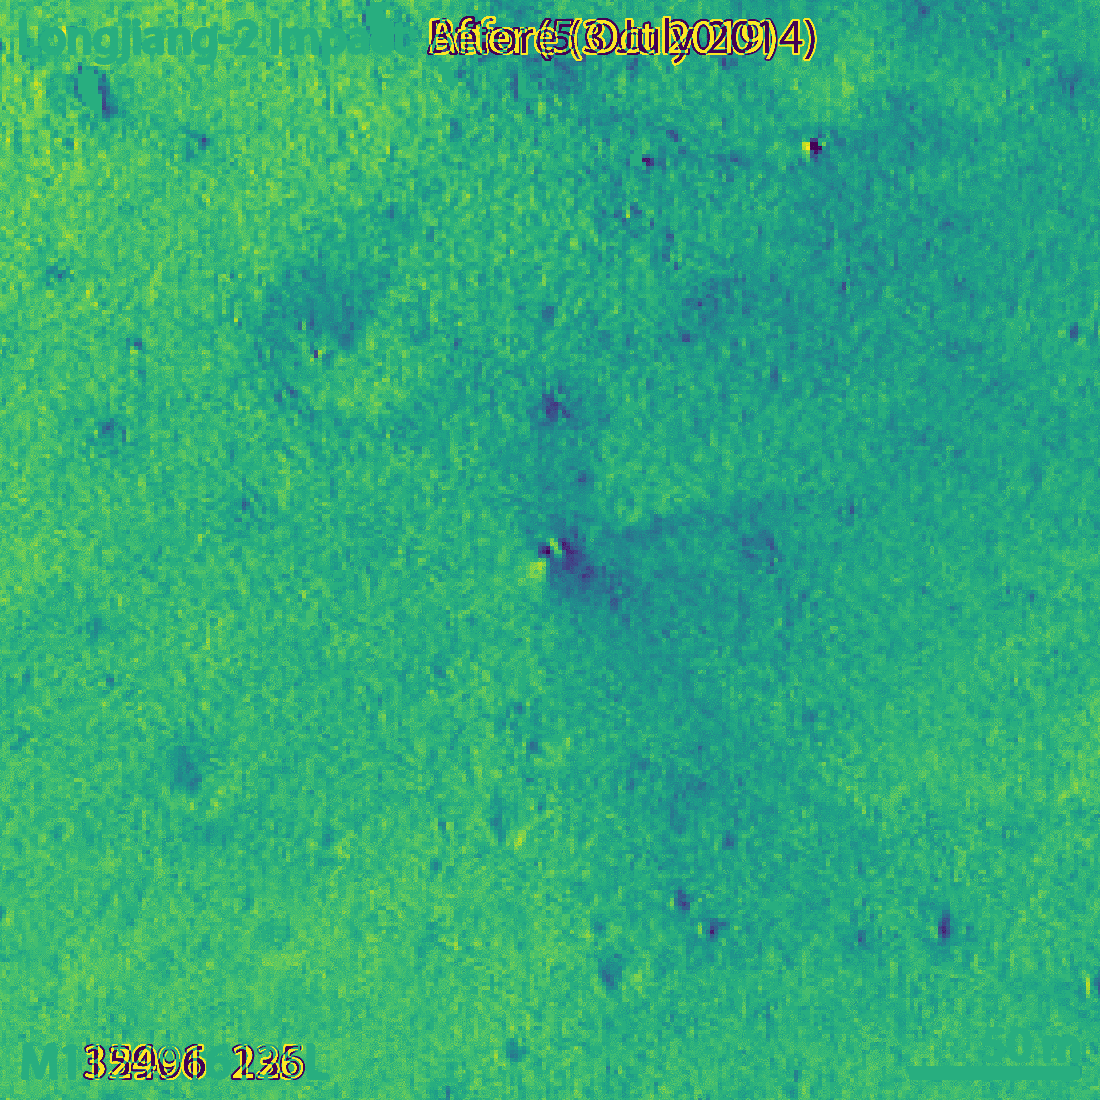
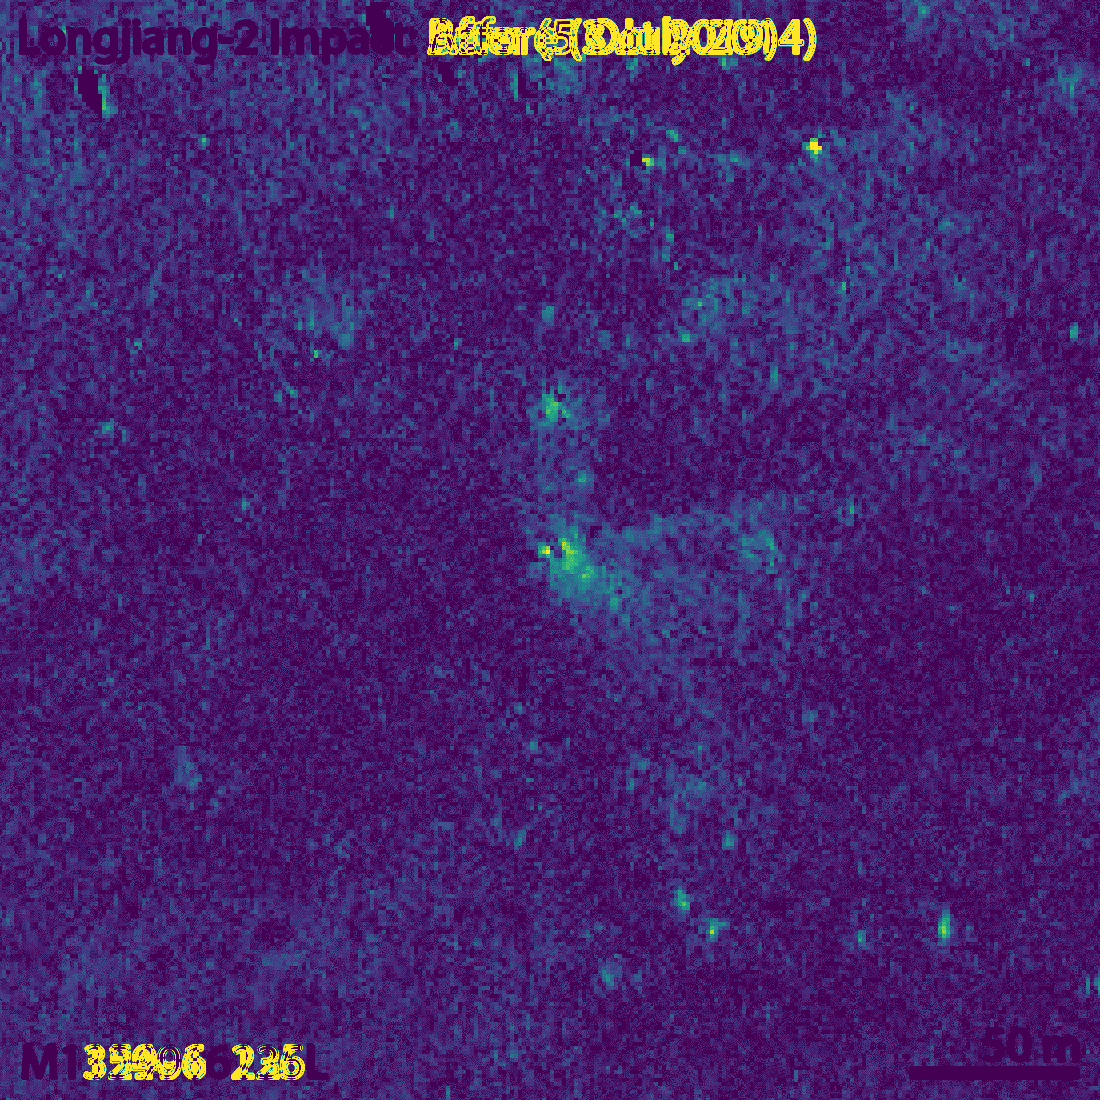
Though my eye fails to see it, the LROC team says that the long axis of the crater is oriented in a southwest-northeast direction. This is consistent with the direction of the impact, since DSLWP-B was travelling towards the northeast.
For the comparison with the October 5 image, the LROC team has chosen an image taken with a similar illumination angle. In fact, the lunar phase in both images only differs in 10º, so the shadows are very similar, with the sun located towards the southwest. In fact, the newest image of the area was taken on 2018-10-16, but the one from 2014 probably gave the most similar illumination conditions.
In my post in August I included a link to Quickmap showing the estimated area of the impact. Now I have marked in red the location of the crash. For a sense of scale, the large crater northwest of the crash is some 50 metres in diameter. You can see both points in Quickmap here.

It is good to go back to all the simulations I did to have an idea of what the 328m error represents. My final simulation was done with the ephemeris from July 25, so they were 6 days old at the moment of impact. When I used the ephemeris from July 18, the position of the impact changed by 231m, while the ephemeris from June 28 yielded a change of 496m. Therefore, it seems that an error of 300m is well in line with what we could expect of the precision of the Chinese DSN ephemeris.
The impact location computed by Cees Bassa was 2786m away from my estimate. The main problem with Cees’s estimate is that the orbital model he used considered spherical gravity for the Moon, while my studies showed that it was important to consider non-spherical gravity.
I did most of my simulations with a 10×10 spherical harmonic model for the Moon gravity, but to assess whether this was enough, I also made a simulation with a 20×20 spherical harmonic model. This yielded an impact point which was 74m away from the impact computed with the 10×10 model.
According to my Monte Carlo simulations with a 1km ephemeris error, the 1-sigma ellipse semi-axes of the impact position were 876m in the northeast direction and 239m in the southeast direction. With this information, I gave an educated guess of the position error of 600m in the northeast direction and 200m in the southeasth direction. The actual impact point is 328m northwest of my estimate, so somewhat higher than my error estimate but still within the 2-sigma ellipse. This leaves me quite happy with the quality of my estimate.
One comment