This weekend I have recorded the full EAPSK63 Spanish PSK63 contest in the 40m band with the goal of playing back the recording later and reporting the stations showing excessively high IMD levels. In PSK contests, it is usual to see terribly distorted signals, which are the result of reckless operating techniques and stations which are setup inadequately. Contest rules don’t help much, as they are usually too weak to prevent distorted signals from interfering other participants. Amateurs should take care and strive to produce a signal as clean as possible. For instance, in the US, Part 97 101 a) states that “each amateur station must be operated in accordance with good engineering and good amateur practice”. Here I describe the signal processing done in this study and list a “hall of shame” of the worst stations I have spotted in my recording. I will notify by email the contest manager and all the stations in this list with the hope that the situation improves in the future.
Some words about IMD
Before passing to the setup of this experiment, let us discuss a few generalities about IMD in Amateur narrowband digital modes such as PSK. A brief introduction to IMD in Amateur PSK modes can be found here. Any signal which doesn’t have a constant amplitude will present intermodulation products because the signal processing stages (for instance, the power amplifier) are not perfectly linear. Intermodulation products broaden the bandwidth of the signal, producing interference to adjacent stations.
In a well designed system, these intermodulation products are pretty weak in comparison with the main signal, so the interference they can produce is very limited. For instance, a clean PSK63 signal will fit in a bandwidth of 80 or 100Hz, and everything outside this bandwidth will be very weak. However, a very distorted PSK63 signal can occupy more than 600Hz, potentially causing interference to many stations. IMD (or intermodulation distortion) is just a measure of the strength of these undesired intermodulation products, in comparison with the main signal.
Some signals, such as FSK, have a constant amplitude, so they are not distorted when passing through a non-linear stage, and IMD is not a problem. However, for PSK and many other modes, one has to be very careful about non-linearities and IMD.
There are two main causes of excessively high IMD in Amateur digital modes. The first is saturation in the audio chain or the transmitter driven into ALC mode. These problems are very easy to solve with a proper station setup, so there is no reason why this should be the cause of high IMD, yet it seems that this is cause of the problem for many stations.
If the digital signal is fed into the transmitter using an audio signal and a soundcard, the output level of the soundcard shouldn’t be too high so that the signal saturates. Of course, clipping should be avoided, but some soundcards get nonlinear for signals near 100% output, so one should also watch out for that and reduce the output level in case this happens. The audio signal fed to the transmitter should be of an adequate level so that the transmitter doesn’t saturate either. Usually this is accomplished by means of a resistive voltage divider and/or an option of the transmitter to set audio input gain.
ALC in the transmitter should be disabled or the signal level should be low enough so that the ALC doesn’t engage. The proper setup will vary between different transmitter models, but one should know how to set up his computer and transmitter properly. The goal is that a clean RF signal is delivered to the power amplifier. With a proper setup this is always possible.
The second cause is poor performance in the power amplifier. This is a problem because it is not easy to design a class AB push-pull PA which has very good IMD performance when driven near its maximum output power. The easy solution to excessive IMD produced in the amplifier is to reduce output power. Recall that if we reduce the power by 1dB, the IMD products of order \(n\) will be reduced by \(n\) dB (and here \(n\) is an odd number greater or equal than 3), so just reducing the power just a little bit will reduce higher order IMD products by a considerable amount.
The only other solution is to modify the amplifier to improve its performance, perhaps by changing the bias or by using better devices. This is not so easy to do and probably not possible for many Amateurs. However, one should be careful when choosing an amplifier. Some of the cheapest models are badly designed and they should be operated at a significant fraction of their rated maximum power to avoid excessively high IMD. For instance, these tests by Charles W8JI on the RM HLA-150 300W amplifier show that this amplifier should be operated below 90W output power for an acceptable IMD. The amplifiers inside commercial transceivers made by the well-known brands usually perform OK, but still one should be careful not to drive the amplifier near saturation.
About the contest rules in EAPSK63
The only mention of distortion in the rules of the EAPSK63 contest is as follows:
Power: Recommended power maximum 50w, in order not to cause interference or splatter to other participants.
However, as I’ve described above, higher power is not the main cause of high levels of IMD. The main cause is improper operation and station setup: operators that don’t know how to setup their audio and RF signal levels or don’t care to do so and operators that don’t monitor their transmit signal to check that it’s clean.
The worse part about this rule is that it’s just a recommendation. Putting something not mandatory in the rules is like not putting anything. Some people will just do anything they can trying to achieve more contacts. They won’t follow recommendations. They will only follow rules that are mandatory and enforced with loss of points or disqualifications.
Recording setup
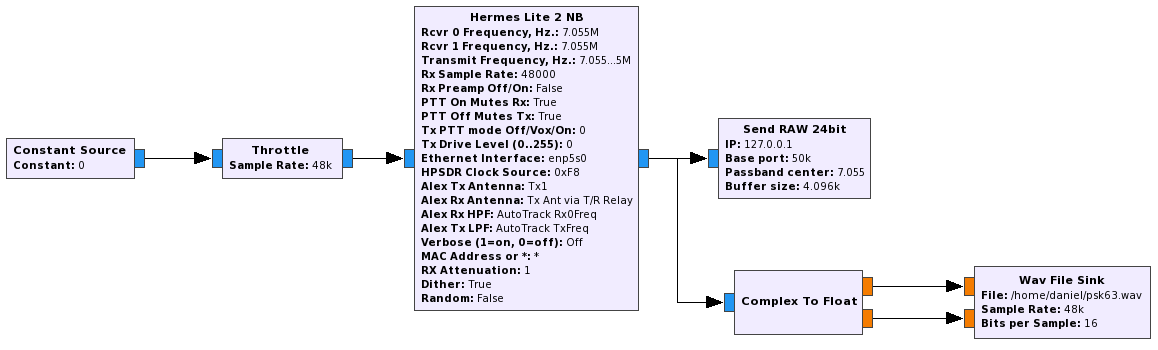
The recording station in this experiment has been my Hermes-Lite 2.0 beta2 board. This is a DDC SDR using the AD9866 12bit frontend at 76.8MHz. The FPGA in this transceiver filters and downsamples the data from the ADC to produce a 24bit 48kHz IQ slice centred at 7.055MHz and streams it over Gigabit Ethernet into my laptop. There, I use gr-hermeslite2 to receive the samples in GNU Radio. The data is saved in a 16bit 48kHz IQ wav file for later processing and also sent into Linrad using gr-linrad for monitoring.
The antenna is a half-wave inverted V dipole for 40m in a not so good location: its feed point is around 8m over the ground, while the tips are almost at ground level. It is also partially occluded by nearby buildings. It is connected to the RX input of the Hermes-Lite 2.0 beta2 without any additional filtering. A gain of 18dB is used in the AD9866. In my RF environment, this setting produces clipping in the ADC only very infrequently.
After the recording finished, about 15 minutes after the end of the contest, stat gives a modification timestamp of 2017-03-12 17:15:11.662109024 +0100. Linrad says that the length of the wav file is 24:30:50. Therefore, we calculate that the start of the recording was 2017-03-11 15:44:21 UTC. The system is running ntpd so this calculation should be accurate to one second. Better resolution can be obtained by counting precisely the number of samples in the wav file, but accuracy of the computer clock is probably not better than 100ms, even with NTP, and one should take into account the delay from the RF input to the computer. The sample rate of the wav file is derived from the TCXO of the Hermes-Lite, which is 0.5ppm. Over a period of 24 hours, this represents an accuracy of 24ms.
I have uploaded the complete wav recording in case anyone wants to do some experiments. The file is pretty large (16GB), so I don’t promise to host it forever, but I’ll try to leave it as long as possible. The file is eapsk63-7055kHz-2017-03-11-154421.wav
Playback setup
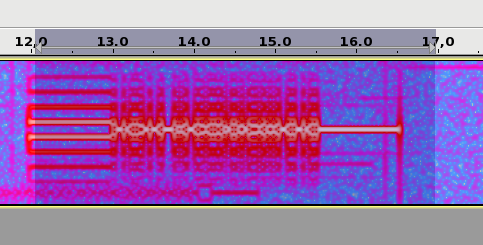
Linrad is used to play the wav recording in CW mode and adequate parameters are set to allow spotting visually in the waterfall signals with inadequate IMD. The parameters are in this gist. The audio output of Linrad is sent into fldigi using snd-aloop. AGC in Linrad is disabled and the audio output level is set low enough to prevent clipping. The BFO in Linrad is set to 1500Hz below the signal, so that the tuned PSK63 signal appears at 1500Hz in fldigi.

The recording is slightly longer than 24 hours, and Linrad-04.12 doesn’t like this. In particular, the “Times for playback” screen (‘F’ key) doesn’t work properly. I have patched Linrad to make it work with recordings longer than 24 hours. This is a very simple patch:
--- a/help.c	2017-02-01 00:09:14.000000000 +0100
+++ b/help.c	2017-03-12 16:55:40.119612866 +0100
@@ -200,7 +200,7 @@
 filetime2*=blk_factor;
 filetime2=diskread_timofday1+filetime2/(snd[RXAD].framesize*ui.rx_ad_speed);
 i=rint(filetime2);
-i%=24*3600;
+//i%=24*3600;
 diskread_timofday2=i;
 if(diskread_timofday2 < diskread_timofday1)diskread_timofday2+=24*3600;
 j=i/3600;
Playback is usually done at a fast rate ('F3' key), going to real time only to examine particular stations when distorted signals are spotted. fldigi is used to identify the station by decoding the PSK63 signal and to perform a first measurement of IMD. When a station with inadequately high IMD is found (around -15dB or worse), Linrad is used to save the audio of the signal to a 16bit 48kHz wav file.
The wav file is then opened with
The segment is saved into a 16bit 8000kHz wav file with the name of the station, RF frequency of the PSK63 signal and time within the recording. For instance, ea4ure-7044330-002210.wav is a signal of the station EA4URE, which appeared at 7044.330kHz at 00:22:10 since the start of the recording. The time is approximate, just enough to help one find the signal within the main recording. Note that the gain between the RF input in the Hermes-Lite and this wav file is fixed. There is no AGC anywhere in the processing chain.
The first samples of this wav file are then used to measure IMD (this is the reason why the wav should start with the "sync tones", as we measure IMD on the idle signal). The fil can also be opened with fldigi to check that the station was correctly identified.
IMD measurement
We measure the IMD on the first 4096 samples (512ms) of the 8kHz wav file generated in the previous step. These samples should contain the PSK63 idle signal centred at (or near) 1500Hz. Python is used to compute an FFT and plot the results. A flat top window is used for the FFT computation, because this window has minimal scalloping loss, which is good for this kind of power measurements. The disadvantage of the flat top window is that it has a poor frequency resolution, of around 5 bins. The FFT bins are 1.95Hz wide, so a resolution of 10Hz is acceptable in this context, as we only need to distinguish each of the PSK63 idle tones and their intermodulation products, which are spaced by 63Hz.
The code is as follows:
How to interpret these measurements?
See below for some of the graphs obtained with the IMD measurement Python script. For someone familiar with IMD measurements they should be self-explanatory. The measurement on the PSK63 idle signal is effectively a two-tone test with tones spaced 63Hz and the strength of the different intermodulation products in dB can be read directly from the graph.
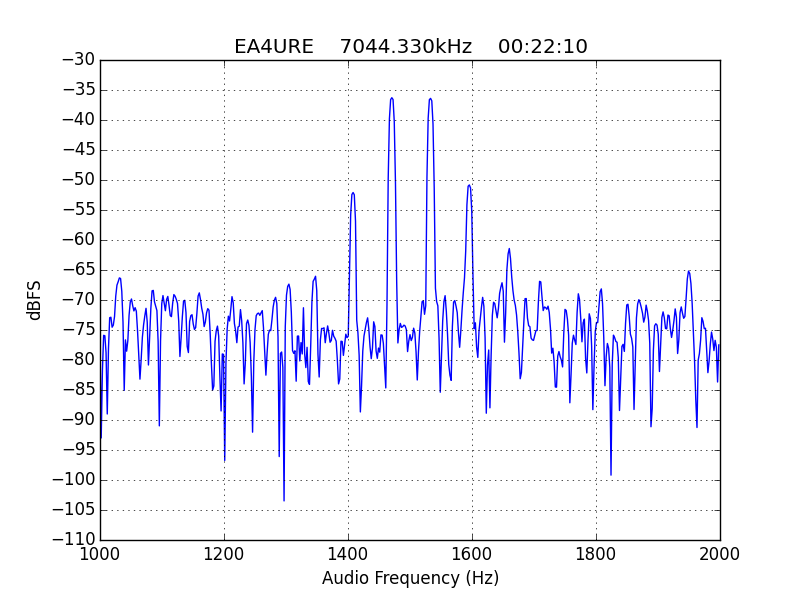
If you are new to IMD measurement, the two strong peaks near the centre of the graph represent the strength of the two tones of the signal. The rest of the peaks, which are spaced at constant intervals, are the intermodulation products. The products which are nearest to the two tones in the centre are the third order products, or IM3, the next products going to the sides of the graph are IM5 and so on. The strength of each signal can be read in dB on the y-axis. We are concerned with the difference between each intermodulation product and the main tones. For instance, if the main tones are at -30dB and the IM3 tones are at -45dB, then we say that IM3 is -15db.
What IMD levels are acceptable?
In this document, a description of IMD levels in PSK signals is done. The rule of thumb is that IMD should be -25dB or better, and -20dB is poor performance, -15dB or worse is awful and -30dB or better is excellent. However, this only concerns IM3, which in a properly configured station is the only product strong enough to cause interference.
Recall that a 1dB reduction in output power will usually reduce the \(n\) order products by \(n\) dB. Therefore, sending the higher order products many dB's down. Hence, it is very easy to make higher order products disappear by reducing the power a little, while it may not be so easy to get rid of lower order products, especially IM3.
However, higher order products are worse because they broaden the signal bandwidth more, as they are farther apart from the centre frequency of the signal. While a PSK63 should fit in 80 or 100Hz, it definitely has to fit in 500Hz, which is the maximum bandwidth allowed in the digital modes segment of the band plan. In fact, one could argue that products outside a 500Hz bandwidth should be at least 40dB down (which is the requirement for spurious emissions in Spain). For PSK63, this means IM9 and higher order products.
Therefore, as a rule of thumb, we should think that IM3 has to be at least 25dB down, IM5 should be much further down (perhaps 35dB) and IM7 and the rest of the higher order products should be very weak, at least 40dB down and perhaps even 50dB down.
Hall of shame
This is a list of stations showing very bad IMD performance, defined as IM3 around -15dB or worse and/or many strong higher order products. By no means this is a complete study, since only the 40m band has been recorded and when playing back the recording I have just watched the waterfall to judge which stations seemed to have terrible IMD. Remember that to measure the IMD well you need a strong signal or otherwise the intermodulation products will be buried in the noise even if they are not weak enough. Many stations where not strong enough to make measurement possible.
The wav files of all the signals analysed here are in eapsk63-2017-40m-imd.tar.bz2 and can be downloaded in case anyone wants to repeat or check the measurements. Now we pass to the list of all the stations in this hall of shame, together with any additional problems that might give credit for "extra shame". Recall that the time shown in each graph is the time from the start of the main recording, not the time of day.
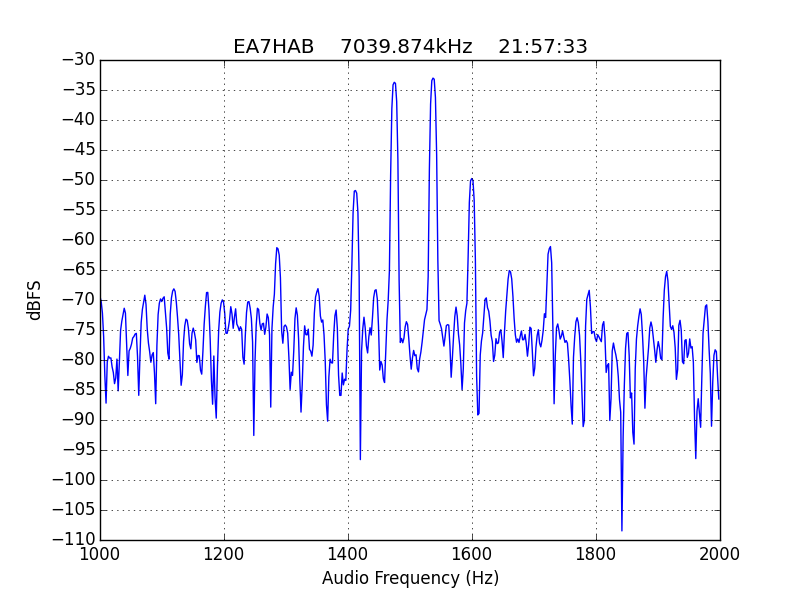
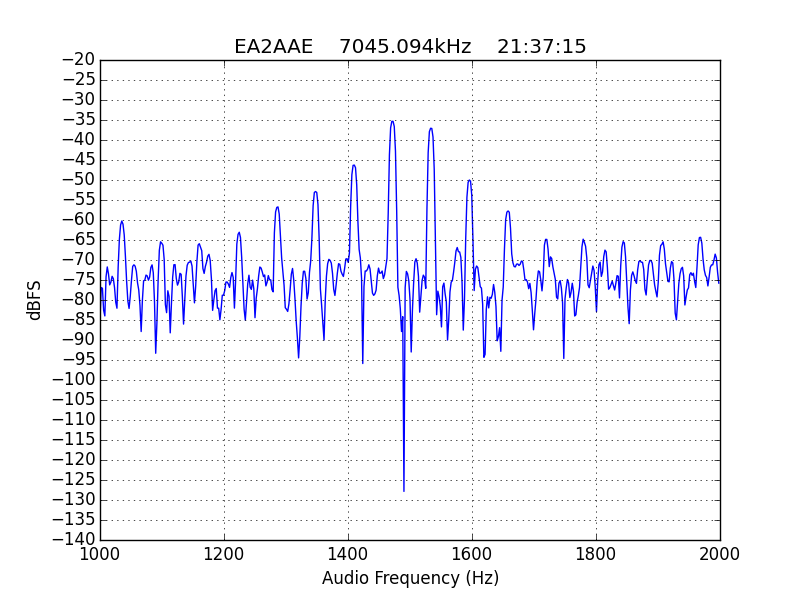
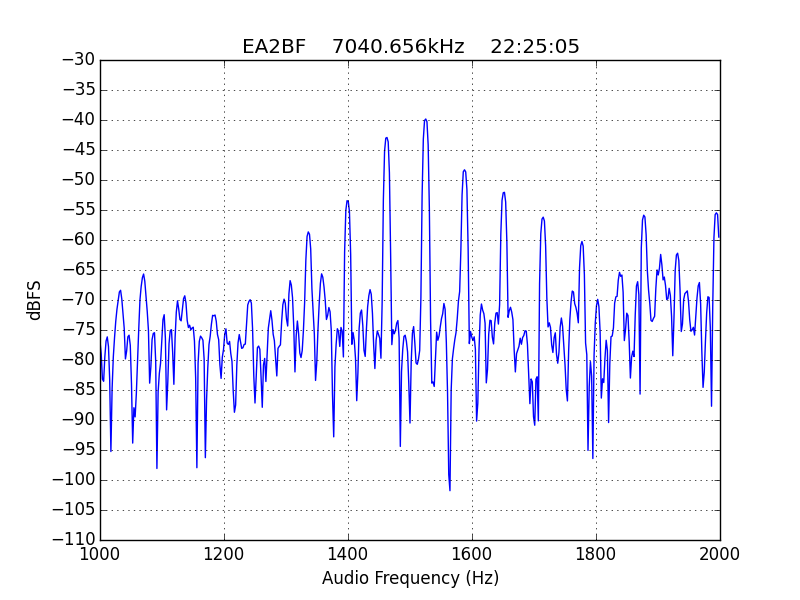
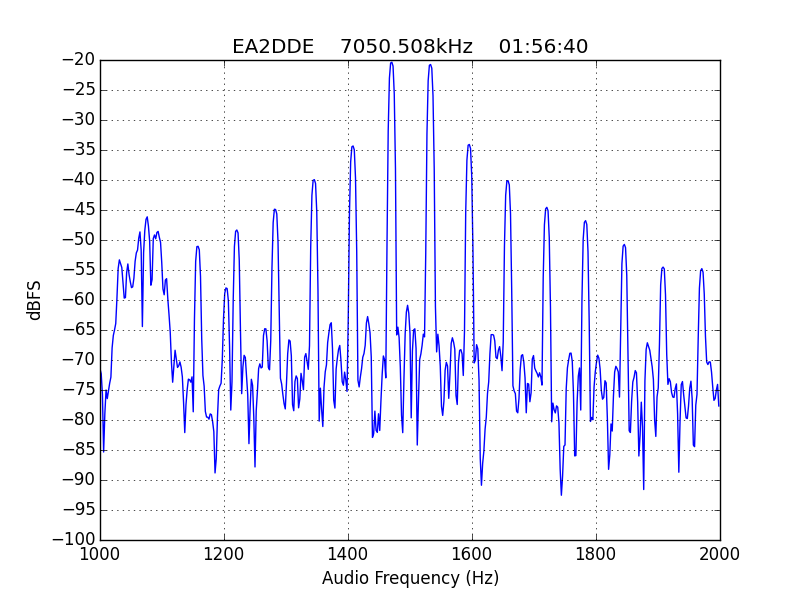
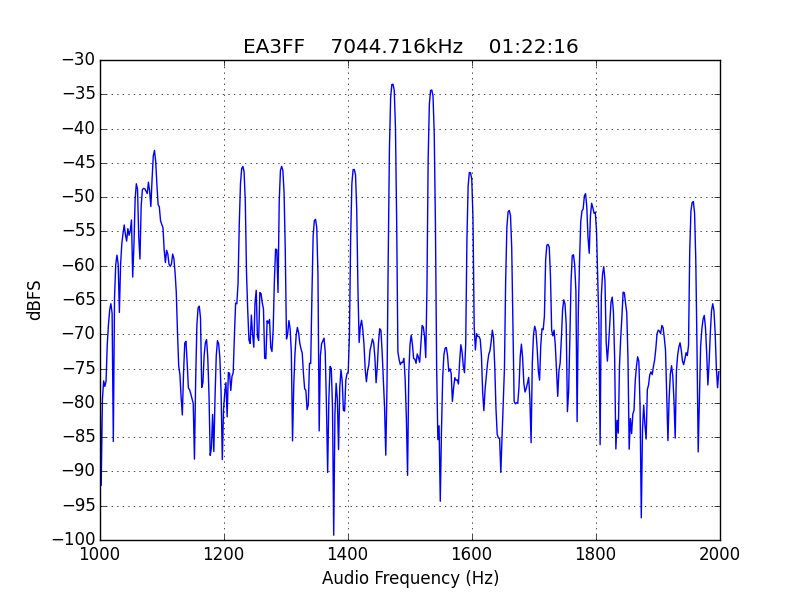
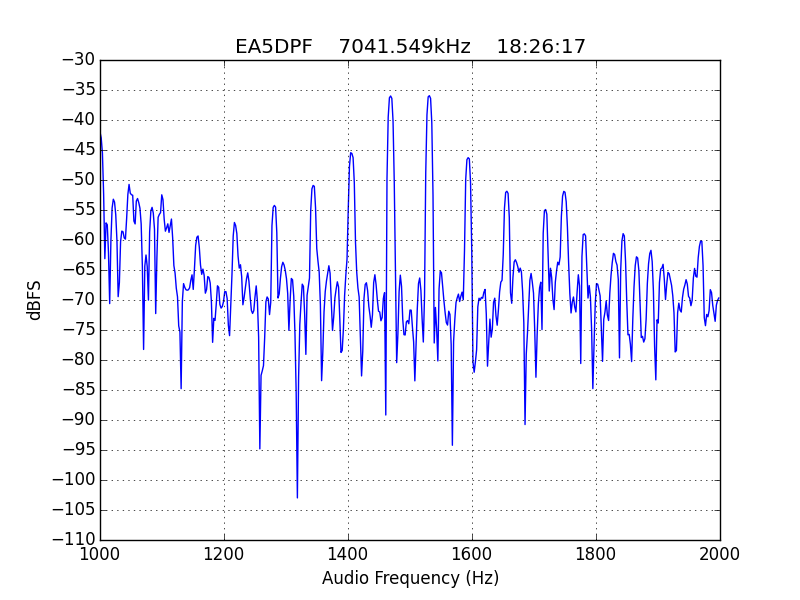
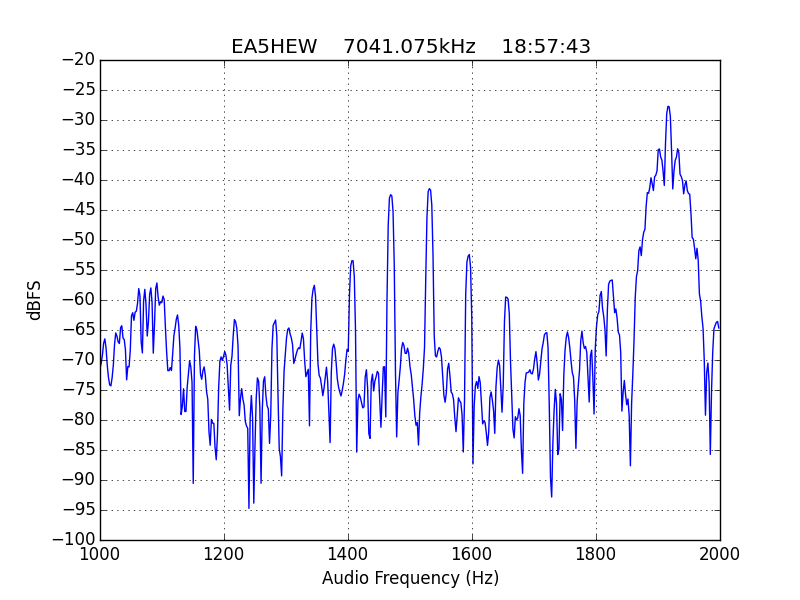
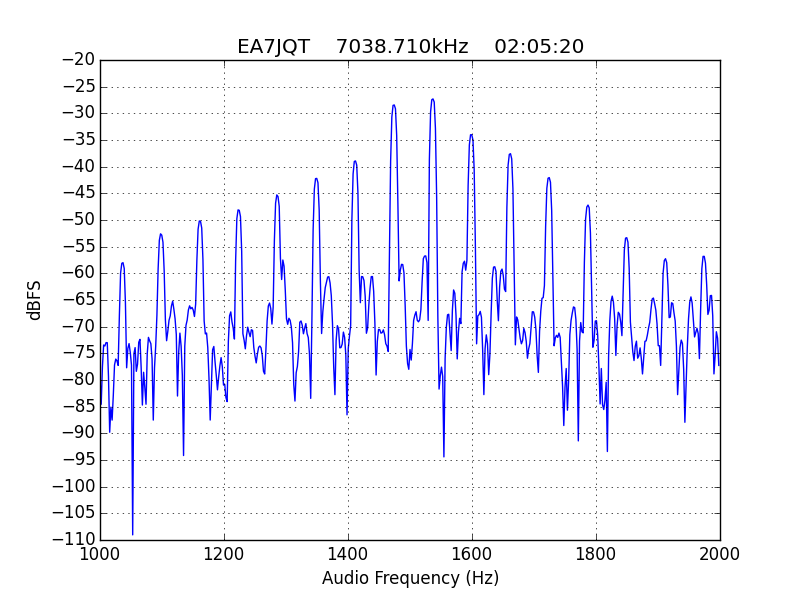
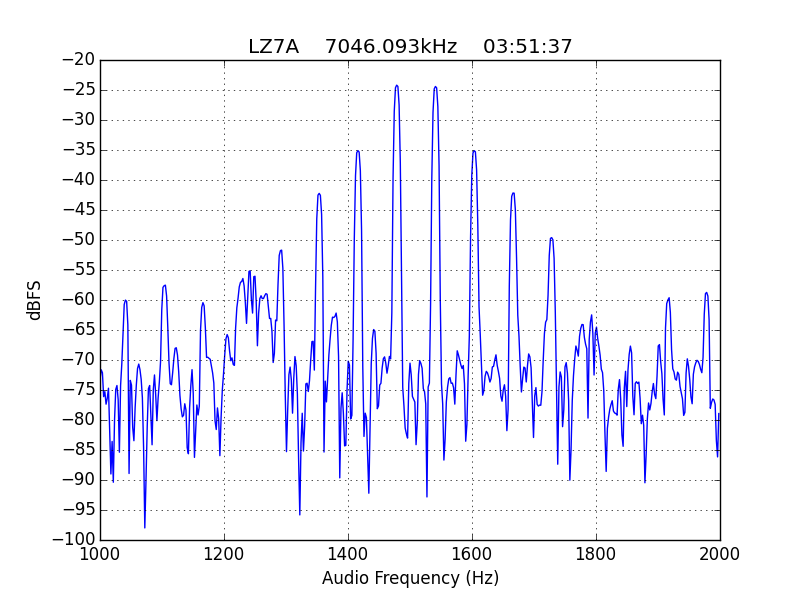
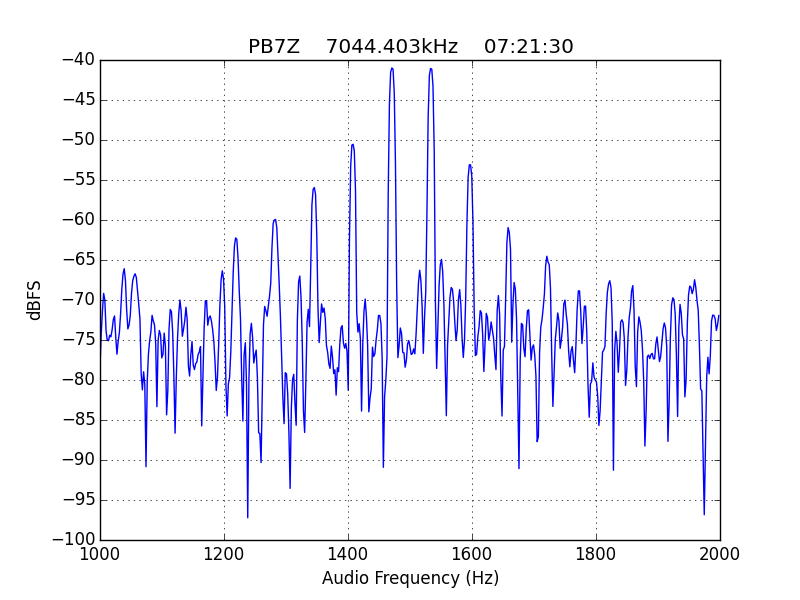
For quick reference, the list of stations in this hall of shame is the following: EA1AYT, EA2AAE, EA2BF, EA2DDE, EA2XR, EA3FF, EA4FJX, EA4URE, EA5AIH, EA5DPF, EA5HEW, EA7HAB, EA7JQT, ED5LD, F5SIZ, IT9VCE, LZ7A, PB7Z, W4UEF.
Extra shame for EA4URE, the HQ station of Unión de Radioaficionados Españoles (the Spanish national Amateur society). It plays a special role in the contest as an extra multiplier. In the graph below, it shows significant IMD, with IM3 worse than -15dB. This station should show exemplary operating techniques and technical performance, since it is a symbol of Spanish Amateur radio. The very bad IMD it shows is unacceptable.
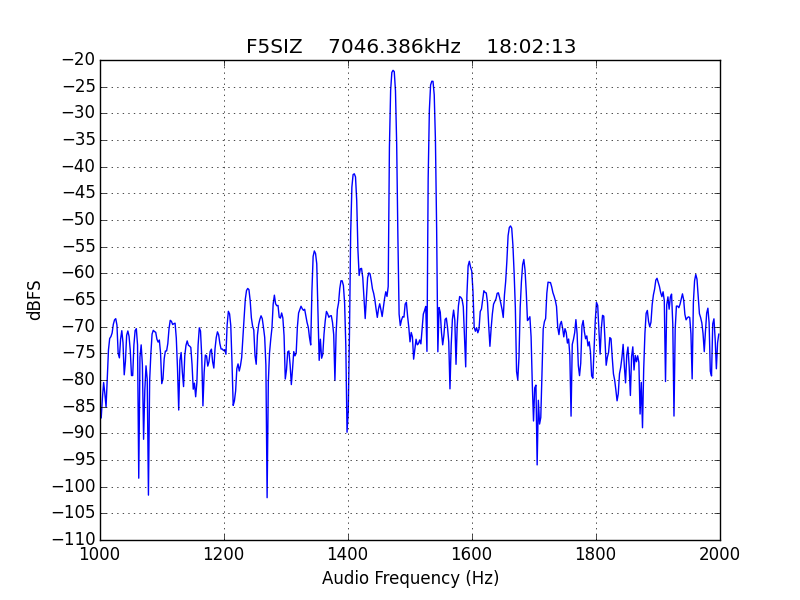
Extra shame for F5SIZ, who not only has a signal which is very unstable in frequency but also puts out all sorts of crap across an SSB transmitter's bandwidth. Its IMD is not so bad but should still be improved.
There are a some stations where only IM3 is strong and the rest of the intermodulation products are weak.

Extra shame for EA7HAB for operating below 7.040kHz, in the segment reserved for CW only. His signal is interesting because IM5 is weak but IM7 is only a bit more than 25dB down.
However, the majority of stations with strong IMD have many strong higher order products, up to IM15. As we have already mentioned, this is completely unacceptable.

EA2BF is the worst station, with IM3 worse than -10dB.

Extra shame for EA7JQT, for operating below 7.040kHz, in the segment reserved for CW only.


Hall of fame
When doing this sort of measurements it is good to process also a clean and strong signal to check that the receive setup is not introducing IMD. When watching the playback, I spotted the following very clean signal, by IW7DBM. IM3, IM5 and IM7 are visible, but all are more than 30dB down, which is excellent. Congratulations. This also shows what is possible with a proper station setup.
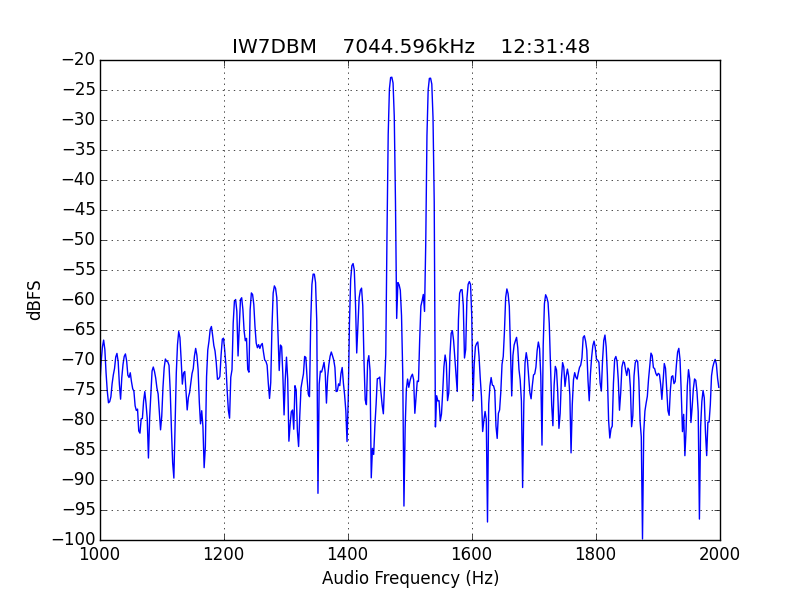
I haven't made any special effort to find the cleanest strong signal. This is just something I came across.
What can be done about this problem?
The first thing that one has to do is to note that this is an important problem. Several of the signals shown above contain strong intermodulation products over a bandwidth of nearly 1kHz. Also, many of these stations were calling CQ for several hours, potentially causing interference to many adjacent stations. I think that this post shows enough evidence that IMD levels in PSK contests are terrible and something should be done about it.
The second thing is that every Amateur operator should know how to operate his station properly and take the effort to do so. Probably many of the signals in the hall of shame can be made much better just by adjusting the audio levels properly or changing the transmitter's ALC setup. The most important thing that you should do is to monitor your own signal to measure IMD levels and take action immediately when there is a problem. Very bad IMD is very easy to spot on the waterfall, but you should also make precise measurements to know where you stand. Software for digital modes can be used to measure IMD, but it will usually report IM3 only. Do take care also that the higher order products are way down.
Monitoring your own signal only requires an SSB receiver (which is easy to get these days in the form of a cheap SDR receiver) and the appropriate software. There is no reason why any Amateur should not monitor his own signal. You can also measure IMD over the air, but keep in mind that it can only be measured on a strong signal. If you can't see the intermodulation products on the waterfall then there is nothing you can measure, since the IMD is below the noise floor. Ideally, you should monitor your signal all the time, but at least you should monitor every time you change your station setup, to check that your signal is still clean.
The third thing is that adequate IMD levels should be enforced by the contest rules. A maximum allowable IMD level should be fixed in the contest rules (ideally taking into account products of different order), the organization should monitor the contest and stations not satisfying the IMD limit should be disqualified. There are also other problems which are even more apparent and should not be neglected by the organization: stations transmitting outside the digital modes segment or on top of some well established working frequency for another digital mode, such as the WSPR segment.
If you've read this far, and especially if your callsign appeared in the hall of shame, please do take care that your signal is clean. Don't hesitate to contact me if you need any help in setting up your station properly. Remember that a clean signal makes a more enjoyable experience on the bands for everyone.
Very interesting! Would you publish more complete information on how to monitor your own signal?
Dave – M0NDT
Hi Dave,
Briefly speaking (I can give more detail if needed), first of all, you need a second SSB receiver or SDR (unless your transceiver is full-duplex). You need some way to get your transmit signal into your second receiver. Many times leakage into your receiver is enough to get an adequate signal. If not, you can always use a small piece of wire as an antenna. The proper solution is to use an RF tap in the output of your amplifier.
Regarding software, you can use a digital modes program with your second receiver to monitor your own signal. For example, you can run a second instance of fldigi. This will measure the IMD of your signal, but only IM3.
Usually, you don’t need very precise measurements. You just need to check that IM3 is -25dB or better and that higher order products are really low. For this, the spectrum display in any SDR program is usually OK. You can use averaging in the spectrum to help you with the measurements.
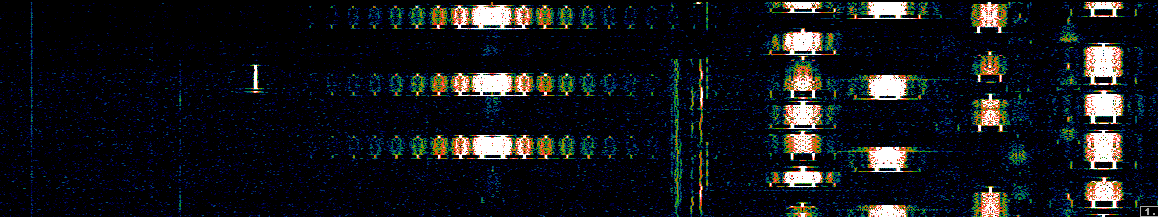
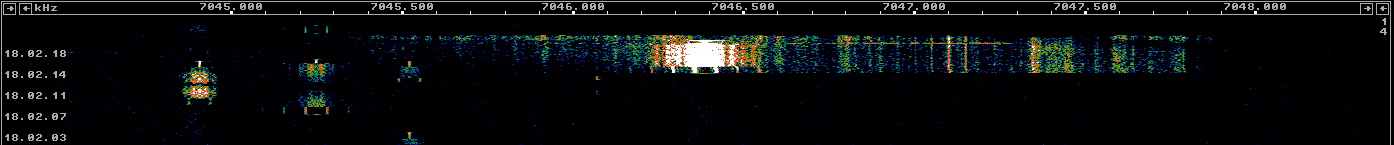
IMD should be measured on the PSK idle signal (which is a pair of tones). It’s easiest to transmit a PSK idle signal to do the measurement. On fldigi, you can press the T/R button and it will transmit and idle signal as long as you want. It’s also good to monitor your signal during normal operation. While IMD can not be measured properly on a PSK signal which is transmitting data, it is really obvious in the waterfall if the IMD is terrible or not. For instance, see the waterfall image on top of this post. The signal in the middle has terrible IMD (lots of “sidebands”), while the rest seem more or less OK (some have visible but relatively weak IM3).
As to my own setup, I have a PAT board to tap off the 70MHz IF of my FT-817ND. A FUNcube Dongle Pro+ is connected to this board and used as a panadapter. During TX the PAT board is switched off, but enough signal leaks from the IF into the FUNcube, so I always monitor my IF TX signal. In this way, I can be sure the soundcard volume and so on are correctly set up (the OS will sometimes change the volume for no apparent reason). The problems in the audio between the computer and transceiver and ALC problems will produce a signal which is already badly distorted at the IF. I also watch all the time for the ALC display on the FT-817ND. No bars should light up, indicating that ALC action is not engaging. I always see my TX IF signal on my panadapter screen (I use Linrad. The setup is described in another post in this blog). This helps me spot easily most problems.
Still, I have to make sure that I’m not driving my amplifiers too hard (near their maximum PEP rating) so that they don’t produce too much IMD. For this, it is enough to develop some sense about how your amplfiers perform and know at which power they still work OK. In my case this is the FT-817ND 5W PA and a Hardrock 50W amplifier. The FT-817ND PA is OK at 5W. The Hardrock is more or less OK at 50W, but runs a bit better at something like 40 or 45W, so I’ll usually run it near 45W (and at this setting I know that the FT-817ND is putting around 3 or 4W, because the gain of the amp is a bit higher than 10dB). I monitor this using an external power meter on the output of the amplifier. Just remember that power meters usually report average power. Therefore, it’s best to do the power measurement on a single tone, because the average power of two tones is half their PEP power. It’s also good to make measurements of your TX signal after your amplifier (not just at the IF). For this, I sometimes change the FUNcube Dongle to HF and perhaps use a small antenna to pick up the RF in the shack.
Now that I’m finishing my Hermes-Lite 2.0 beta2 board, I plan to change my HF station completely, leaving the FT-817ND for V/UHF and portable work. The Hermes-Lite is full duplex, so I can use it to monitor my own signal. At some point, I even plan to set up adaptive predistortion, which measures the TX signal to correct for the amplifier nonlinearities and improves IMD even more.