Continuing with my research on using WSJT-X modes through linear transponder satellites in low Earth orbit (see part I and part II), a few days ago I transmitted and recorded an FT8 signal through the V/U linear transponder on FO-29 during a complete pass. The recording started at 2017/10/23 20:26:00 UTC and ended at 20:42:30 UTC. It was made with a FUNcube Dongle Pro+ set to a centre frequency of 435.850MHz and connected to a handheld Arrow satellite yagi through a duplexer. Here the duplexer was used to avoid desense on transmit.
An FT8 signal was transmitted on every even period during the recording, at a fixed frequency of 145.990MHz, using a Yaesu FT-817ND and the Arrow antenna. The signal was transmitted using lower sideband (i.e., inverted in the frequency domain) to get a correct FT8 signal through the inverting transponder. The transmit power was adjusted often to get a reasonable signal through the transponder and avoid using excessive power. There have been reports and complaints of people using too much power with digital modes through linear satellites. In this post, a study of the power is included to show that it is possible to use digital modes effectively without putting any pressure on the satellite’s transponder.
Out of the 33 even periods, a total of 24 can be decoded by WSJT-X using the best TLEs from Space-Track. No measures were taken to correct for the time offset \(\delta\) that has been studied in the previous posts, as the TLEs already provided a good Doppler correction. Regarding the choice of TLEs, there are still some remarks to make. First, the epoch of the TLEs used was 2017/10/23 21:39:16 UTC, so these TLEs were actually taken after the pass. The previous TLEs were taken a few hours before the pass, and it is likely that they also provided a good correction, perhaps by using a time offset \(\delta\) if necessary. However, I do not know if these previous TLEs were also available from CelesTrak before the start of the pass, as it seems that TLEs take a while to propagate from Space-Track to Celestrack. To explain why the TLEs with no time offset correction are enough, it will be interesting to study the rate of change of TLE parameters for FO-29. This will be done in a future post.
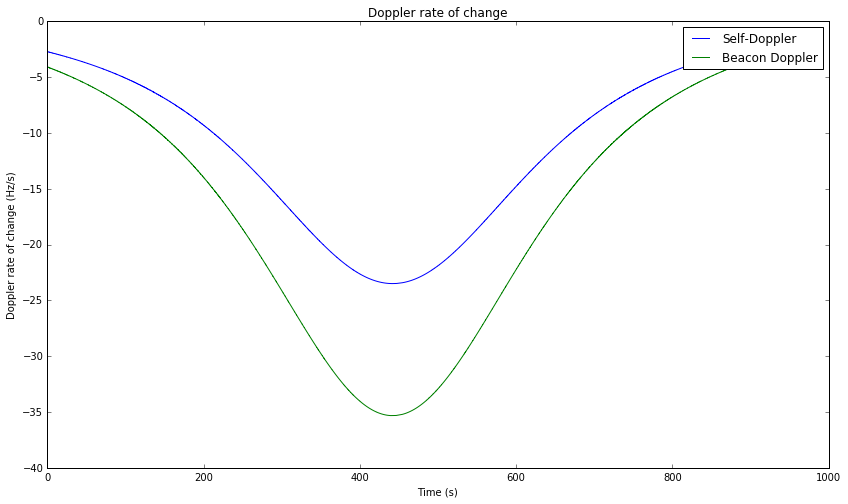
The results of this test look very promising. Even though this wasn’t an overhead pass (the maximum elevation was 40º), the maximum rate of change of the Doppler was over 20Hz/s for the self-Doppler seen on the FT8 signal and 35Hz/s for the downlink Doppler seen on the CW beacon. Most of the periods which couldn’t be decoded were near the start or end of the pass. This is the only test that I know of that has decoded FT8 signals in the presence of high rates of change of Doppler. The previous tests by other people were made at low elevations, where the rate of change of Doppler is small. This test has shown that it is possible to get many decodes with high rates of change of Doppler, even using no corrections to the TLEs. Here I continue with a detailed analysis of the recording.
The TLE used has been
1 24278U 96046B   17296.90226955 -.00000046 +00000-0 -99197-5 0  9993
2 24278 098.5410 162.9058 0350559 003.9820 356.3983 13.53079989046036
and my station location has been 40.5962ºN, 3.6963ºW, 700m ASL approximately. With this data, we get the following Doppler profiles for the self-Doppler (which is the Doppler when I listen to my signal through the transponder) and the CW beacon Doppler.
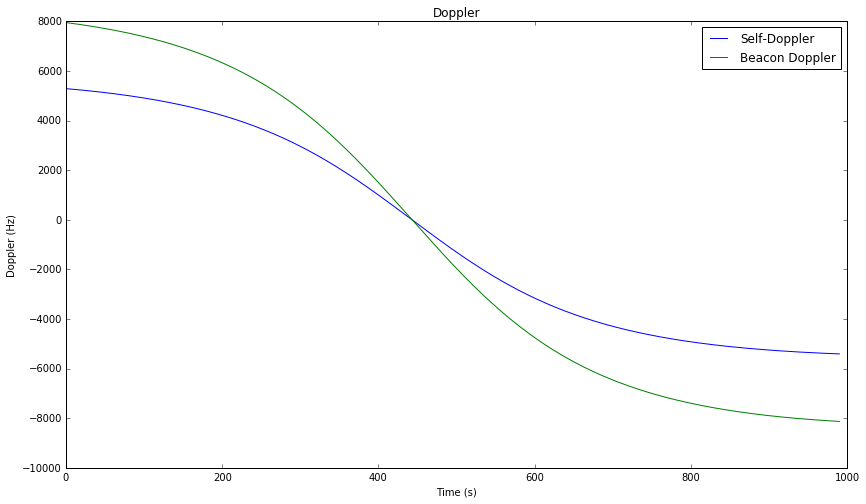
Note that since the linear transponder is inverting, the uplink Doppler cancels out a fraction of the downlink Doppler. In comparison, the CW beacon has the full downlink Doppler. This is the reason why most linear transponders in LEO satellites are inverting.
The figure below shows the rate of change Doppler (the derivative of Doppler with respect to time). We see rates of change of over 35Hz/s for the beacon Doppler. In comparison, in parts I and II we studied an overhead pass of LilacSat-1, which has a much lower orbit than FO-29. There we saw rates of change of over 150Hz/s, so the situation in the FO-29 pass used in this test is much easier. It would be interesting to study, for each satellite, the distribution of the maximum Doppler rate of change in the pass, over a large number of passes.
Using a Jupyter notebook, the recording is Doppler corrected and each of the 15 second periods is extracted in a WAV file suitable for processing with WSJT-X. In this case we use the command line tool jt9 from WSJT-X 1.8.0, but the WAV files can also be opened with wsjtx (see this post for some information about how to use the WSJT-X command line tools). These are the decodes obtained:
202700 -17  0.0 1406 ~
202830  -4  0.0 1412 ~
202900 -24  0.0 1413 ~
202930 -17  0.0 1416 ~
203000 -13  0.0 1419 ~
203030  -4  0.0 1422 ~
203100  -4  0.0 1422 ~
203200  -7  0.0 1430 ~
203230  -8  0.0 1433 ~
203300  -4  0.0 1437 ~
203330  -8  0.0 1441 ~
203400 -12  0.0 1442 ~
203430  -8  0.0 1450 ~
203500 -10  0.0 1451 ~
203530  -7  0.0 1458 ~
203600 -14  0.0 1459 ~
203630  -8  0.0 1466 ~
203700  -4 -0.0 1467 ~
203730 -12  0.0 1470 ~
203800  -5  0.0 1476 ~
203900 -11  0.0 1482 ~
203930 -17 -0.0 1488 ~
204030 -13 -0.0 1493 ~
204100  -5  0.0 1500 ~
In these decodes, we observe several things. First, the message is empty. The reason for this is that I intended to transmit the free text message “TEST EA4GPZ”, and I configured WSJT-X to do so during my tests before the pass. However, at some point when setting up the pass, I inadvertently cleared out the free text box in WSJT-X and only noticed it after the pass. This mistake is not a huge problem, since an empty FT8 message is as difficult to decode as one containing “TEST EA4GPZ”. The only problem is that you should identify your transmissions with your callsign (which I failed to do here).
The next remark is that the DT (delta time) for all the decodes is zero. This means that there is not a lot of buffering while recording in Linrad. This is important, as a long buffer would introduce a delay that would affect Doppler correction (we would need to use \(\delta\) to account for that delay). Note that the round trip time to the satellite is on the order of 10ms or less, so we can ignore it here. Nevertheless, it should be possible to do a coarse study of the round trip time using this recording.
Another thing to note is that the frequency of the decodes keeps increasing with time, increasing roughly 100Hz throughout the pass. This is best seen in the figure below.
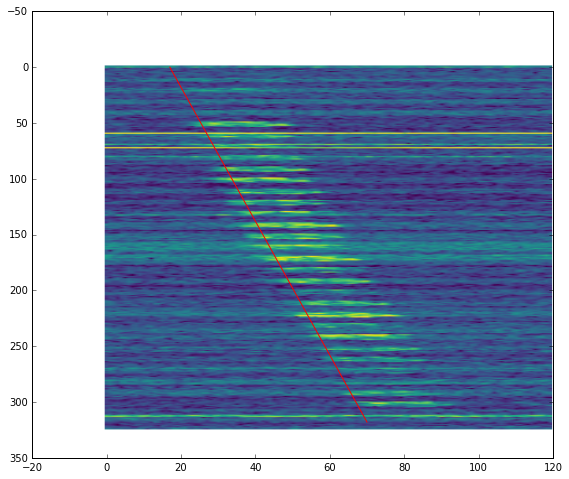
This image shows the spectrum of the Doppler corrected FT8 signal. The vertical axis is time and the horizontal axis is frequency. The time spans all the recording. We see that there is a linear frequency drift. The red line has been fitted by eyeball. Its slope is 111mHz/s.
We can process the CW beacon in the same way. We see a similar linear frequency drift, but with a smaller slope: 85mHz/s.
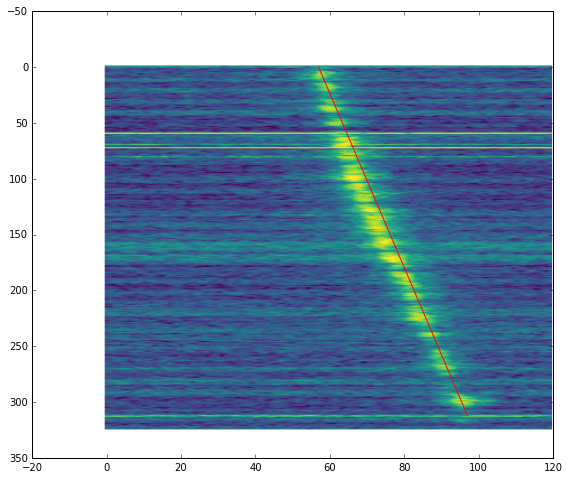
The fact that the linear drift is present in both the FT8 signal and the CW beacon rules out my transmitter as the cause of it. Since the drift is different for both signals, it is not caused by my receiver either. The fact that the CW beacon, which has a larger Doppler, has a smaller drift means that Doppler is not the cause.
I think that the cause for this linear drift is a linear drift in the local oscillator in FO-29. This explains the different slopes rather well. Assume that the linear transponder in FO-29 has an IF at a frequency \(f_{\text{IF}}\), and that the IF is below the uplink frequency, which is most likely the case. Then the first local oscillator, which mixes the uplink down to IF, has a frequency \(f_{\text{LO}_1}\). There are two cases for this frequency: it is either \(f_U – f_{\text{IF}}\) or \(f_U + f_{\text{IF}}\), where \(f_U = 145.950\text{MHz}\) is the uplink frequency. The second local oscillator has a frequency of \(f_{\text{LO}_2}\) which mixes the IF up to the downlink frequency \(f_D = 435.850\text{MHz}\). Since the transponder is inverting, in the first case we must have \(f_{\text{LO}_2} = f_D + f_{\text{IF}}\) and in the second case we must have \(f_{\text{LO}_2} = f_D – f_{\text{IF}}\). In both cases we have a total frequency conversion from input to output of \(f_U + f_D\), since the IF frequency cancels out.
On the other hand, the CW beacon is directly generated at a frequency \(f_D\) (actually, it is generated 55kHz below \(f_D\), but this is a small difference). Therefore, assuming that all the clocks in FO-29 are generated from the same oscillator (or perhaps from different oscillators that drift in a similar manner), the drift observed through the linear transponder would be proportional to \(f_U + f_D\), while the drift of the CW beacon would be proportional to \(f_D\). If we compute the quotient between the drift of the linear transponder and the CW beacon, we would get \(f_U/f_D + 1 = 1.335\). In the recording, the quotient between drifts is \(1.306\). This matches the theory up to an error of 2%.
I haven’t been able to find the RF block diagram of FO-29 to validate that my understanding is correct, but a reasoning similar to the one given above can be applied to most frequency conversion schemes. For me, this is enough evidence to conclude that the linear drift in this test has been caused by a drift in the local oscillator in FO-29. Still, it is amazing that the drift is almost perfectly linear. Maybe the cause is thermal: the satellite entered eclipse at 20:25 UTC, just before the pass, and continued in eclipse during all the pass.
After estimating the linear frequency drift in the FT8 signal and in the CW beacon, we can include a correction for it, so that the corrected signals now present little drift. These corrected signals can be used for a study of power. There have been many concerns about people using too much power in digital modes tests, causing interference to other users of the transponder. In this test, the uplink power was carefully adjusted often to prevent a strong downlink signal. This test shows that it is possible to achieve effective communications using digital modes while using little power from the satellite transponder.
The total energy spectral density in the recording can be calculated by computing and summing spectrums. The energy spectral density can also be understood as average power spectral density. The figure below shows the energy spectral density for the FT8 signal and CW beacon computed over all the recording.
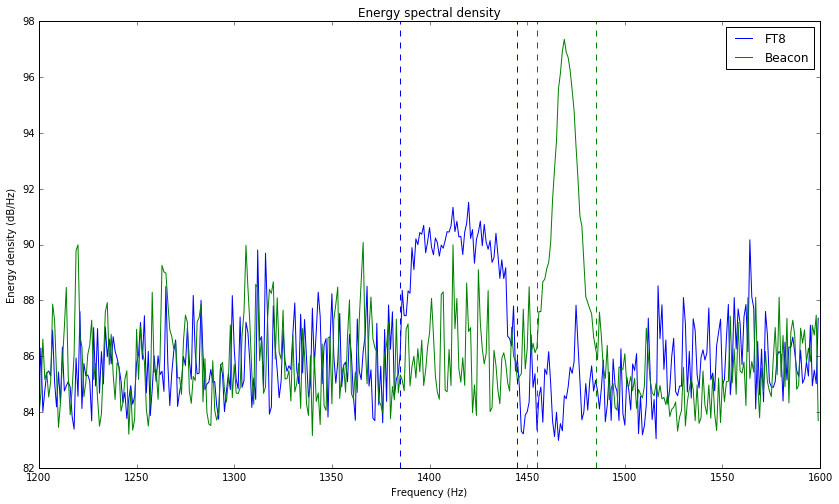
If we sum the bins between the dashed vertical lines, we get a total energy of 107.52dB for the FT8 signal and 107.78dB for the CW beacon. In other words: the strength of the FT8 is similar to the strength of the beacon. This follows the rule of thumb of keeping your downlink signal not much stronger than the beacon. Judging by the decodes from WSJT-X, many of them have a rather high SNR, so maybe 5dB less power would have yielded similarly good results.
On the other hand, a look at the stations using SSB and CW through the transponder in this recording will probably reveal that they are using much more power than my FT8 signal, especially those stations using CW. Perhaps I will prepare some high resolution waterfalls to show this in a future post.
A final word about downlink frequencies is in order. The centre frequencies for the uplink and downlink of the FO-29 transponder are 145.950MHz and 435.850MHz respectively. Since the FT8 signal was uplinked at a constant frequency of 145.990MHz, after correcting for self-Doppler it would be expected at a frequency of 435.810MHz. However, it was found around 4.2kHz higher. Similarly, the CW beacon has a nominal frequency of 435.795MHz, but was found 3.6kHz higher. These offsets are probably due to offsets in the local oscillators of FO-29. The remark is that, even if we use a perfect Doppler correction, these offsets make it difficult to set a 3kHz slice of the transponder for WSJT-X use, unless the offsets are relatively stable and can be measured and published.
The computations used in this post have been carried out in this Jupyter notebook. The IQ recording of the pass can be downloaded here (725MB), and the file fo29.tar.bz2 (53MB) contains the processed FT8 signal and CW beacon WAV files.
Great work. What tx power did you use? And typical gain estimate of the arrow antenna?
Hi Jacques, I’m not sure about the power I used, since I used the internal battery in the FT-817ND, but there was not much battery left. I also reduced the power as needed to avoid a strong downlink signal. Probably the transmit power was less than 1W.
Arrow doesn’t publish gain figures for their antennas, but from a 3 element yagi (the Arrow on 2m) we can expect around 7dBi, and from a 7 element yagi (the Arrow on 70cm) we can expect around 12dBi of gain.
thanks for these caraful studies, they are really intersting and progress in the state of art of amateur radio