Lately, I have been testing the GPSDO that I will use to discipline my Es’hail 2 groundstation. One of the tests I have done is to measure the frequency of the TCXO that I use in my Hermes-Lite 2.0beta2 over a few days. Here I show the details of the measurement process and how to process the data in Python.
The GPSDO in question is a DF9NP 10MHz GPSDO that I use to drive a 27 MHz PLL, also made by Dieter DF9NP. The 27MHz signal is used as an external reference for a Ku-band LNBF.
Since the 27MHz signal is quite strong, it leaks considerably into my Hermes-Lite HF transceiver. By measuring the frequency of this signal, as received in the Hermes-Lite, I can derive the frequency of the TCXO used in the Hermes-Lite. The TCXO in question is an Abracon ASTXR-12-38.400MHZ-514054-T, which is rated for a stability of 500ppb over a temperature range of -40 to 85ºC.
To measure the frequency of the 27MHz signal, I have used WSJT-X 2.0.0-rc3 in frequency measurement mode. This produces frequency measurements with a measurement interval of a few seconds (for some reason the measurement interval is irregular, usually ranging from 2 to 5 seconds). The measurements are stored into a text file called fmt.all.
I have made a Jupyter notebook to read this file and do some plots. The notebook can be found in fmt.ipynb, together with the fmt.all file I have used. I am using xarray, a library I have discovered recently and which provides a good way to handle most of the data I’m typically using.
The plot below shows the frequency offset in ppb of the 38.4MHz TCXO. The measurements have been done over the course of almost eight days, from 2018-11-06 to 2018-11-14.
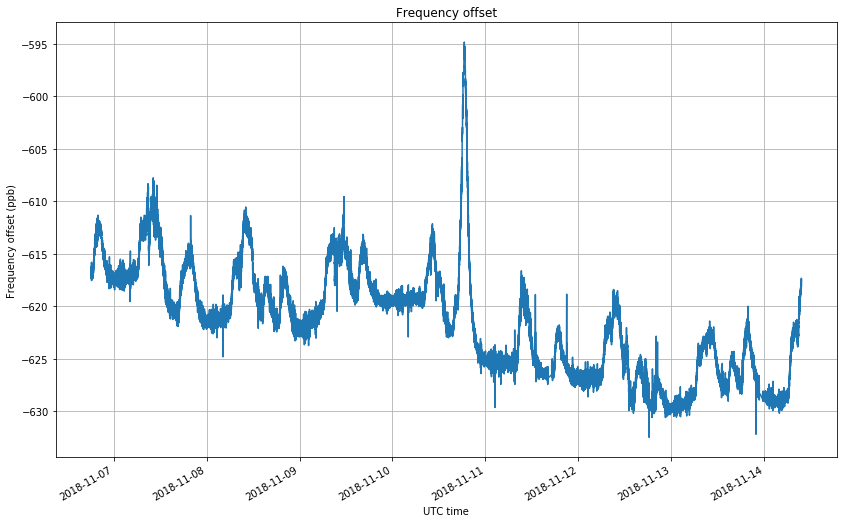
The graph shows some daily variations, mostly due to temperature variations in the house. An overall decreasing trend is also observed. The rate of change is about 1.8 ppb/day.
As I have already mentioned in the past, crystals usually go down in frequency when they age, due to mass transfer. Back in August 2017, when I did that experiment, I measured the frequency of my 38.4MHz TCXO to be 110ppb low in frequency. Approximately 450 days have passed since then, which accounts for an average rate of 1.14 ppb/day. This agrees to some extent with the value of 1.8 ppb/day I’ve eyeballed on the graph above.
The daily variations are best studied in the graph below, which plots the frequency for each day with a different colour.
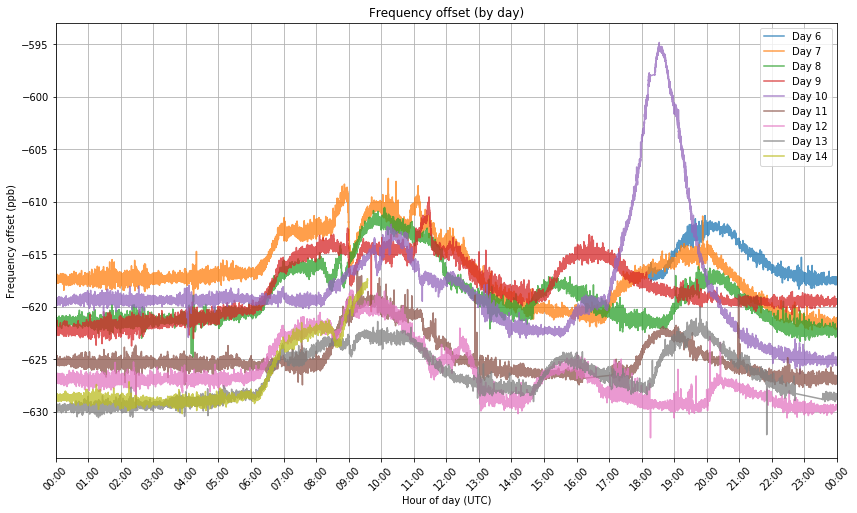
The local time in Spain this time of the year is UTC + 1. The frequency variations are mostly due to the temperature changes as the house heating comes on and off during the day. Between 22:00 UTC and 6:00 UTC the frequency is quite stable, because the heating is off and people are sleeping. Around 6:30 the heating system comes on (later on days 10 and 11, which were the weekend) and the temperature and the TCXO frequency raises during the morning. Throughout the day one can see some repetitive patterns that most likely correspond to the usual human activity in the house and the cycles used by the heating system control to keep the house temperature as programmed. I find it quite interesting to see all this in the frequency of a simple crystal. Before you ask, I have no clue what happened on day 10 at 18:00 UTC.
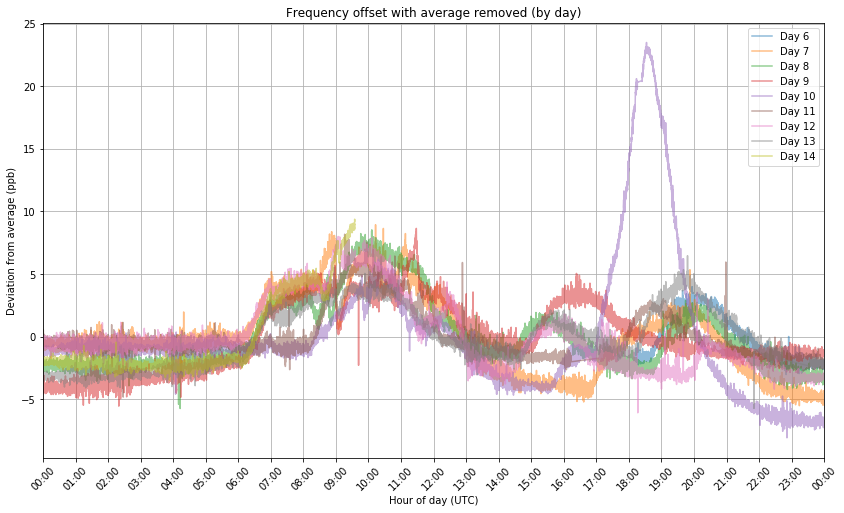
The next graph is the same as above, but with the daily average removed. This counteracts most of the decreasing trend and shows much better the daily variations, which are quite consistent in the morning, but not so consistent in the afternoon.
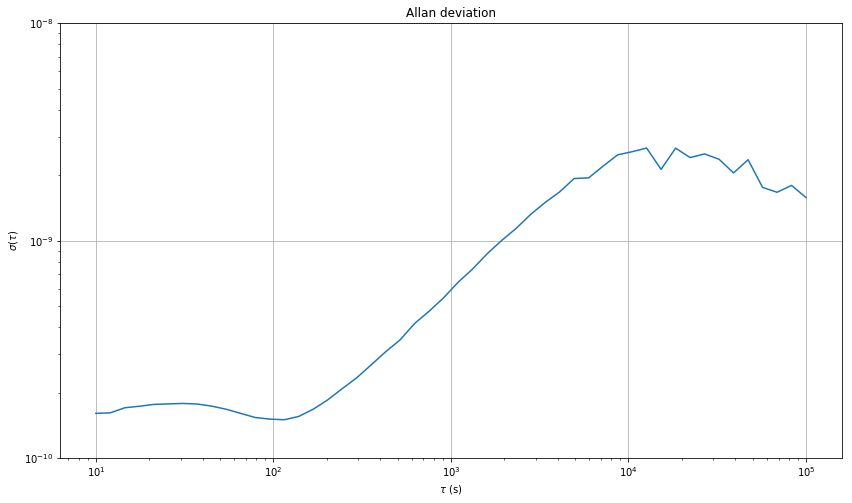
Finally, I have computed the Allan deviation, which is a one-liner function using the xarray resample function. The deviation is as expected for a TCXO. It is around \(10^{-10}\) for \(\tau\) between 10 and 100 seconds, owing to the good short-term stability of the TCXO. Then it starts increasing for higher \(\tau\)s, due to temperature variations and crystal ageing.