Yesterday I looked at decoding some data transmitted by LES-5. Today I have analysed a longer recording made by Scott Tilley VE7TIL to perform an eclipse timing on 2020-03-25. The study has been done in this Jupyter notebook, which looks at the sequences of symbols extracted before and after the eclipse (they are kept as two separate sequences because the transmit frequency changed slightly after the eclipse, so decoding required two separate passes).
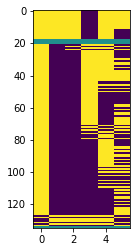
The 1024 bit frames are shown in the figure below, with one frame per line. The turquoise portion has been inserted to mark clearly the separation between frames before the eclipse and after the eclipse, and to align the two sequences. I haven’t tried to guess where the frames begin, so choice of the first bit of the frames is arbitrary.
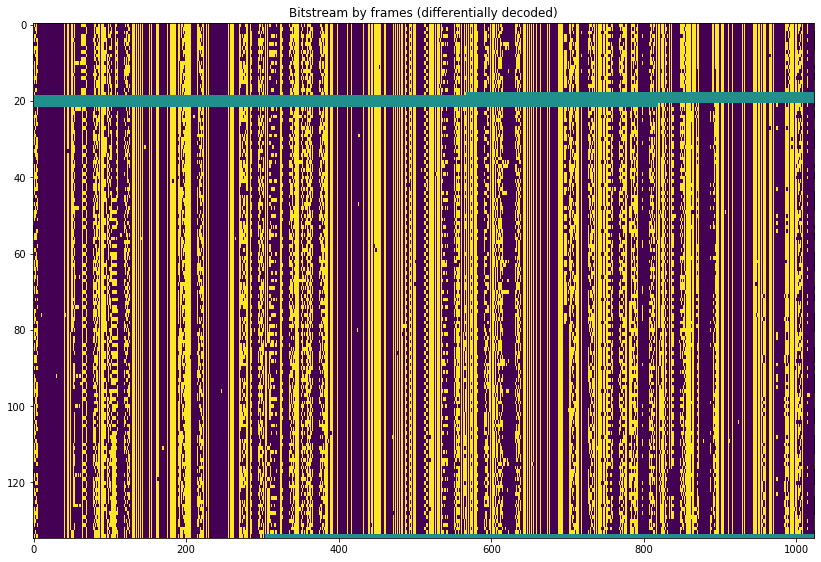
We can see that there is little variation in some parts of the frame, while others change more. In the Jupyter notebook I have also split the frames in 128 bit segments in order to see clearly each individual bit.
In the document we have, in page 56 it is stated that “The basic sampling interval for LES-5 telemetry is 10.24sec”. Note that this coincides with a length of a 1024 bit frame. Therefore, I have the impression that most of the contents of the frame are real-time telemetry values from sensors, measured every 10.24 seconds.
I have done some guesswork to try to spot some fields that might make sense when interpreted as integer values and plotted against time. Of course I have no clue to what any of these really are.
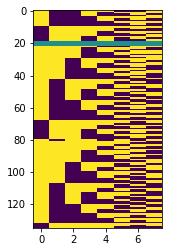
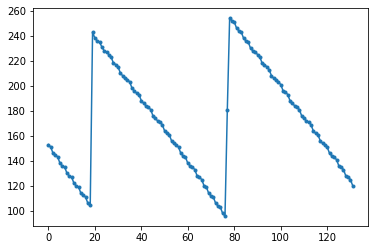
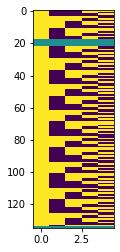
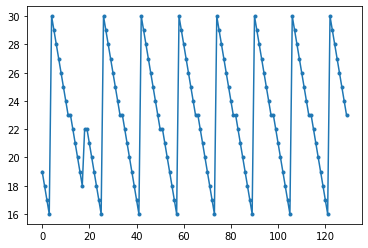
The most promising are bits 191 to 198 and 703 to 707, which show sawtooth waves of different frequencies.
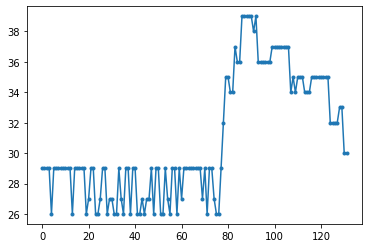
Another fields that have caught my eye are the following two. Bits 49 to 54 show an almost constant value just before and after the eclipse. However, ten minutes after the eclipse the value jumps up and decreases slowly.

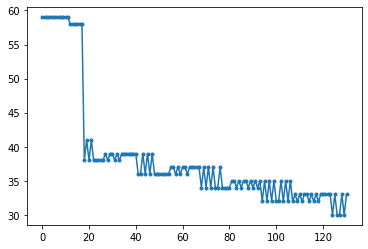
Bits 865 to 870 have a nearly constant value before the eclipse. Just after the spacecraft comes out of the eclipse, they jump down and keep decreasing slowly.
As stated above, I don’t have any clue what any of these fields represent. The eclipse affects almost all spacecraft parameters directly or indirectly, from solar voltages to temperatures. Therefore, it is natural to see its effect on most of the telemetry channels. I’m somewhat fascinated by the sawtooth waves. They don’t seem to represent any sort of frame counter. Maybe they’re some kind of angular parameter?
2 comments