After decoding a recording of the LES-5 236.7MHz telemetry beacon made by Scott Tilley VE7TIL, I have decoded an older recording made by Scott of the S-band beacon of LES-9. This satellite was launched in 1976 and it has a 100 baud BPSK beacon at 2250MHz. Scott twitted about it in April 2019, and in January 2020 he reported that the modulation had stopped and the beacon was now a CW carrier.
I have used this recording made by Scott in 2020-01-13. The GNU Radio demodulator, which is very similar to the one for LES-5, is here and the Jupyter notebook with the results is here. Below, I make a brief summary of the results.
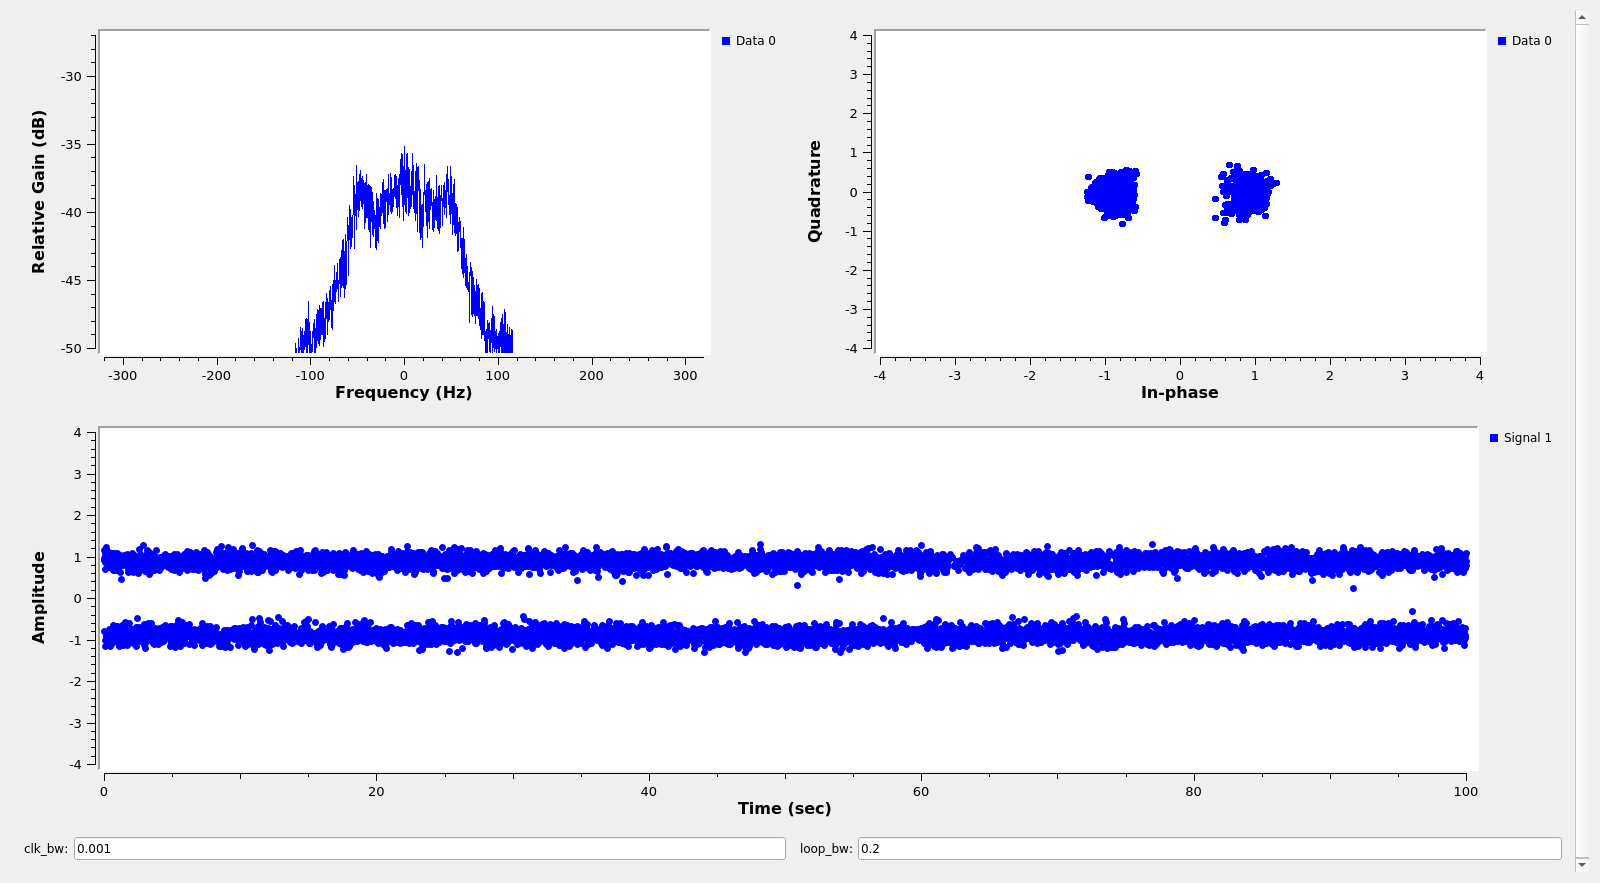
This is the demodulator running on the signal. The SNR is somewhat better than on the LES-5 signal, and the symbols are very well separated in the constellation, so most likely there are no bit errors.
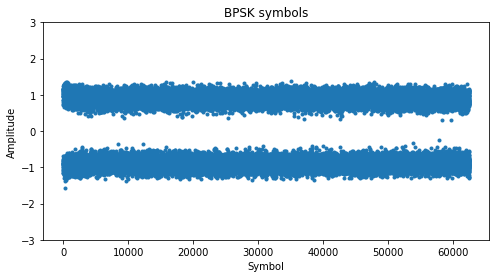
The symbols demodulated from the recording are shown below. There are slightly more than 60000 symbols, corresponding to a recording somewhat longer than 10 minutes.
As in the case of LES-5, the data is differentially encoded. However, it seems that LES-9 uses NRZ-I encoding (a 0 is encoded as a change in the symbol, a 1 is encoded as no change in the symbol) rather than differential encoding as LES-5. I have arrived to this conclusion because I think it is more likely for the data to have long strings of zeros rather than long strings of ones. Thus, I’ve performed NRZ-I decoding before analysing the bitstream any further
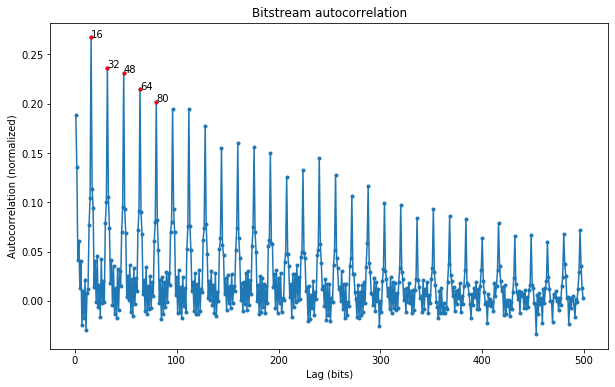
Below I show the autocorrelation for small lags. Interestingly, there is a strong autocorrelation at 16 bits of lag and multiples.
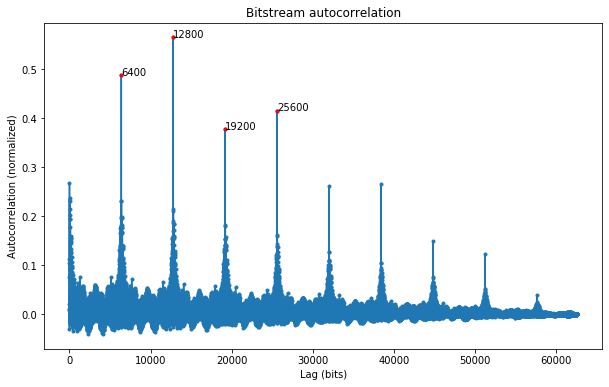
The figure below shows the full autocorrelation. The strong peak at a lag of 6400 bits shows that the frame size is 6400 bits, in contrast with the LES-5 size of 1024 bits.
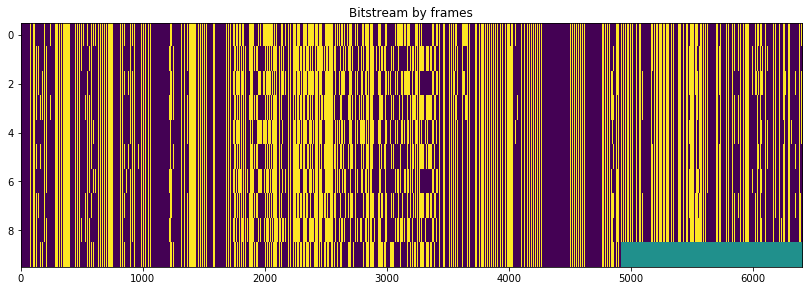
The frames are shown below. I have laid the bitstream in rows of 6400 bits, making no attempt to find the start of the frames. As we can see, there is a lot of repeating structure. The frames look somewhat similar to the LES-5 frames I demodulated in my previous post.
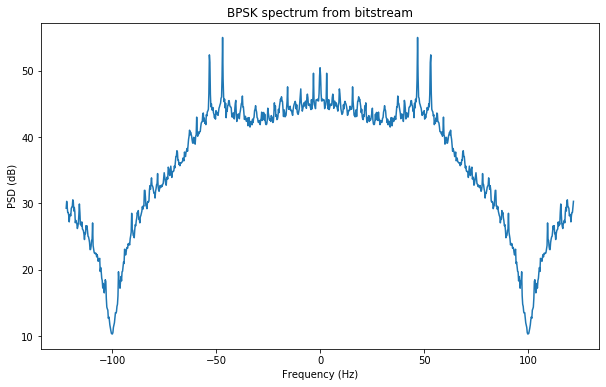
The figure below shows the spectrum of a BPSK signal constructed from the demodulated symbols. This is clearly different from the sinc-like spectrum of a BPSK with random data, indicating the presence of rich structure in the data. For example, the strong peaks near +/-50Hz are most likely caused by the long strings of zeros, which under NRZ-I encoding become 0101010…