The SMOG-P 1P PocketQube that was launched recently has an interesting payload: a UHF spectrum monitor that records power spectral density measurements. Lately, I have been adding support in gr-satellites to decode the telemetry frames transmitted by SMOG-P and ATL-1 (which also carries a similar spectrum monitor), using the code published here as a reference.
As a result of this work, now it is possible to save and plot the spectrum data transmitted by SMOG-P and ATL-1 using gr-satellites. This post explains how.
If you have a look at the smog_p.grc and atl_1.grc flowgraph in gr-satellites, you’ll see a SMOG-P/ATL-1 spectrum save block, shown below.
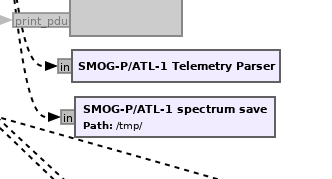
This block saves the spectrum data received in the telemetry into different files in the folder indicated in “path” (by default /tmp/ is used). The names of these files include the measurement metadata. For example, the filename
spectrum_start_824000000_step_24000_rbw_6_measid_312
indicates that the starting frequency of the measurement is 824MHz, that each measurement point is 24kHz wide and that this is measurement number 312. I am not sure about the meaning of the “rbw” (presumably resolution bandwidth).
The spectrum data is transmitted as a list of uint8_t‘s, in chunks carried in different telemetry packets. It can take a dozen or more of these packets to transmit a complete spectrum measurement.
The data in the spectrum files is initialized as zeros, with the appropriate size corresponding to the full measurement. Then data is written in its correct location as it is received. Thus, the zeros that remain in the file correspond to lost packets. This makes it easy to combine partial files of the same measurement, such as those obtained in different groundstations or from different passes.
The script smog_p_spectrum.py, in the apps folder of gr-satellites, can be used to make a PNG plot of these files. This script is run as
./smog_p_spectrum.py spectrum_start_824000000_step_24000_rbw_6_measid_312
It will produce a file called spectrum_312.png in the same folder as the spectrum data file.
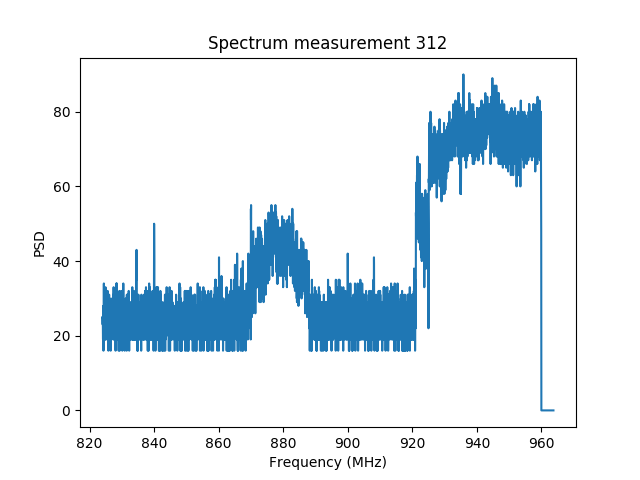
I have tested this code with a recording I made with the BME WebSDR on 2019-12-07. In that pass, two spectrum measurements were transmitted by SMOG-P. The first of them covers the high UHF band and shows some signals on the GSM-850 band and some stronger signals around 950MHz. Note that the last chunk of this measurement is missing.
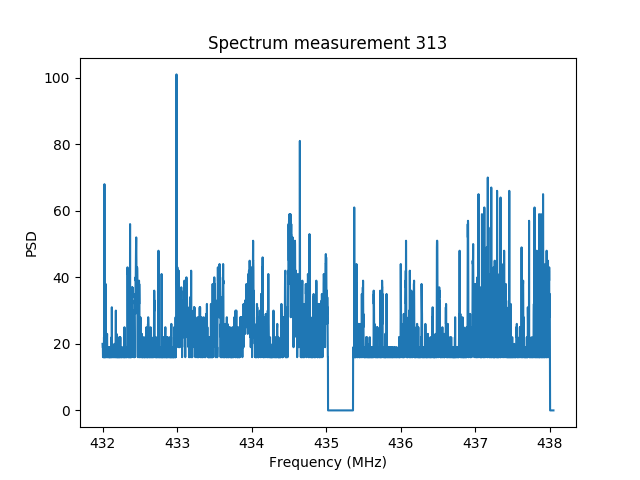
The second measurement covers most of the Amateur 70cm band, but it is hard to discern any signals here. A chunk is missing in the middle of the image.
The spectrum data files used in this post can be obtained in this gist.
A description of the spectrum monitoring system that will be carried by SMOG-1, which is similar to SMOG-P, can be seen in this paper.
One comment