IM-1, the first lunar lander mission from Intuitive Machines, also called Odysseus, was launched on February 15 from KSC, and landed on February 22 near Malapert crater, in the lunar south pole region. The mission has been a partial success. The vehicle did not manage to land upright, and broke one of its legs due to landing with too much horizontal velocity. Despite this unfavourable attitude, communications with the lander have been able to proceed at reduced data rates, and some images and science data have been returned. On February 29, the mission ended, as lunar night started on the landing location. Congratulations to Intuitive Machines for all the milestones achieved in their first mission.
In this post I will examine some recordings of the S-band telemetry signal done by AMSAT-DL with the 20 metre antenna in Bochum observatory. These recordings were done while the lander was still in-orbit. When landed on the Moon, IM-1 used the same configuration, but the recordings done at Bochum are probably too weak to decode, due to the orientation of the lander antennas.
I will look at two recordings in this post:
2024-02-15_17-11-34_288000SPS_2210570000Hz.s162024-02-22_20-10-59_144000SPS_2210600000Hz.s16
The spacecraft is using different configurations in the two recordings. When landed, IM-1 used the same configuration as in the recording from February 22.
According to FCC paperwork, IM-1 has two Thales Alenia transceivers with 5 dBic low-gain antennas and 8 W output power, and two Quasonix transmitters with a 15 dBic high-gain antenna and 25 W output power for high-speed data. These recordings are likely from the Thales radios, although IM-1 also used the Quasonix transmitter with the low-gain antennas for low-speed data at the end of the mission to improve its link budget.
In the first recording, the modulation and coding is residual-carrier PCM/PSK/PM with a baudrate of approximately 2511.5 baud and a subcarrier frequency of 12 times the baudrate, which gives 30.138 kHz. In the second recording, the modulation is suppressed-carrier BPSK, also with a baudrate of approximately 2511.5 baud. The coding is the same in both configurations: CCSDS k=7, r=1/2 convolutional coding, with 153-byte AOS frames.
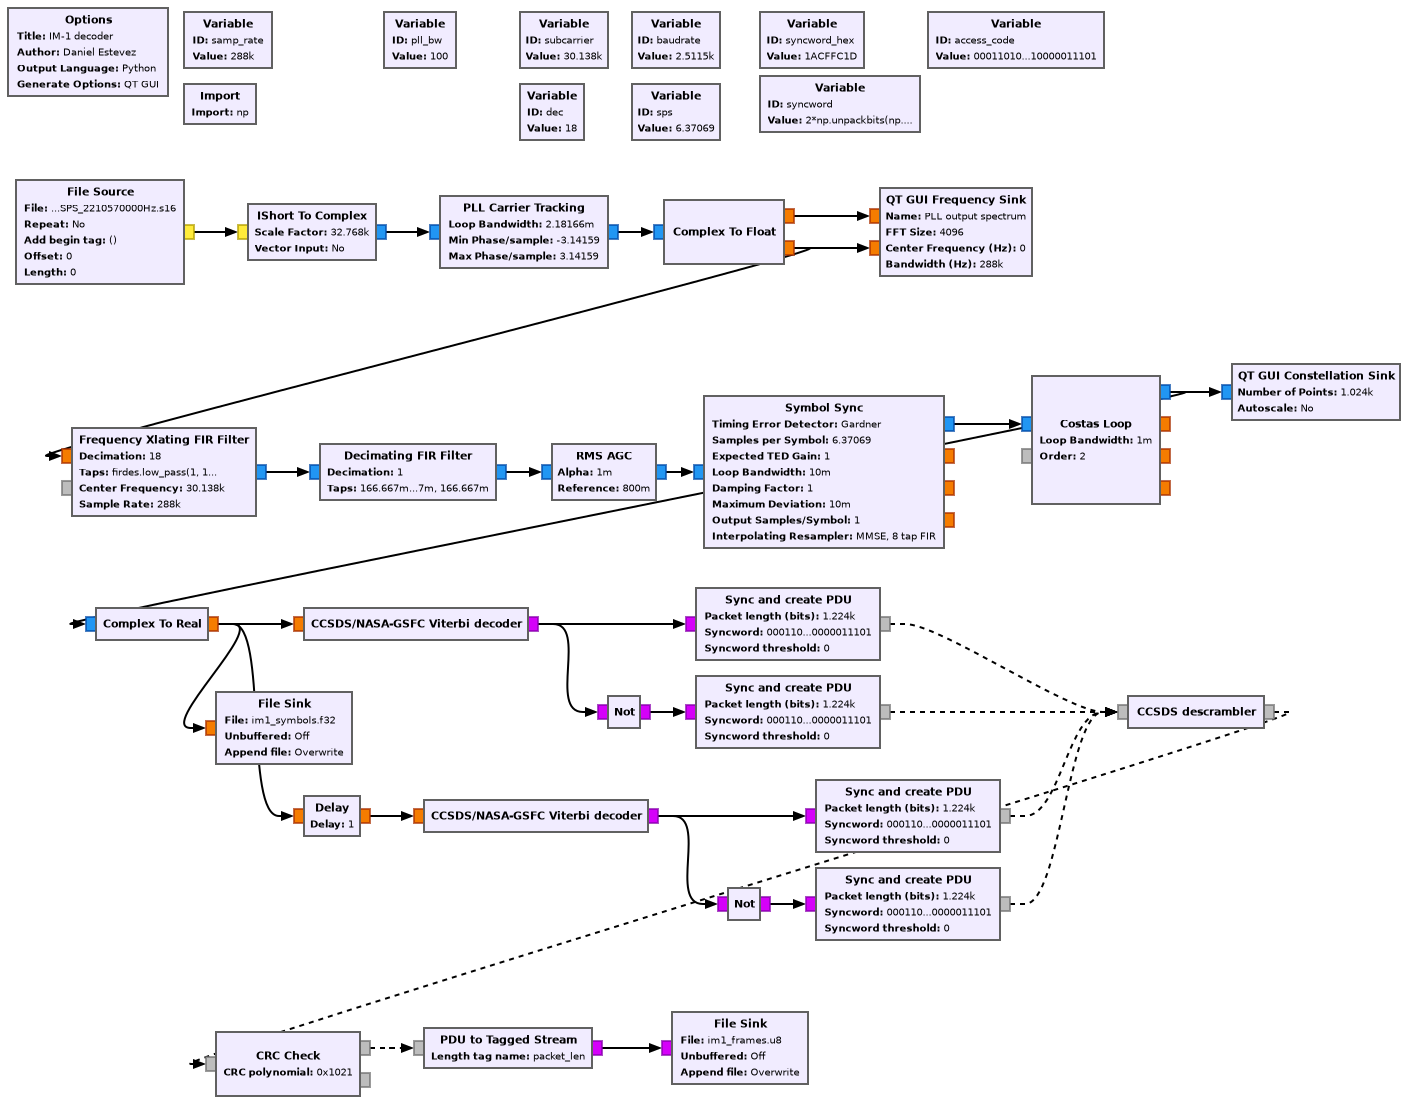
Here is the flowgraph that I’ve used to decode the signal in the first recording. It is a typical demodulator for PCM/PSK/PM, followed by Viterbi decoders and a Sync and create PDU blocks to find the ASM and extract the packets. Two Viterbi decoders are used in parallel to test both possible pairings of BPSK symbols, and each of these feeds two Sync and create PDU blocks that test the two possible 180 degrees phase ambiguities.
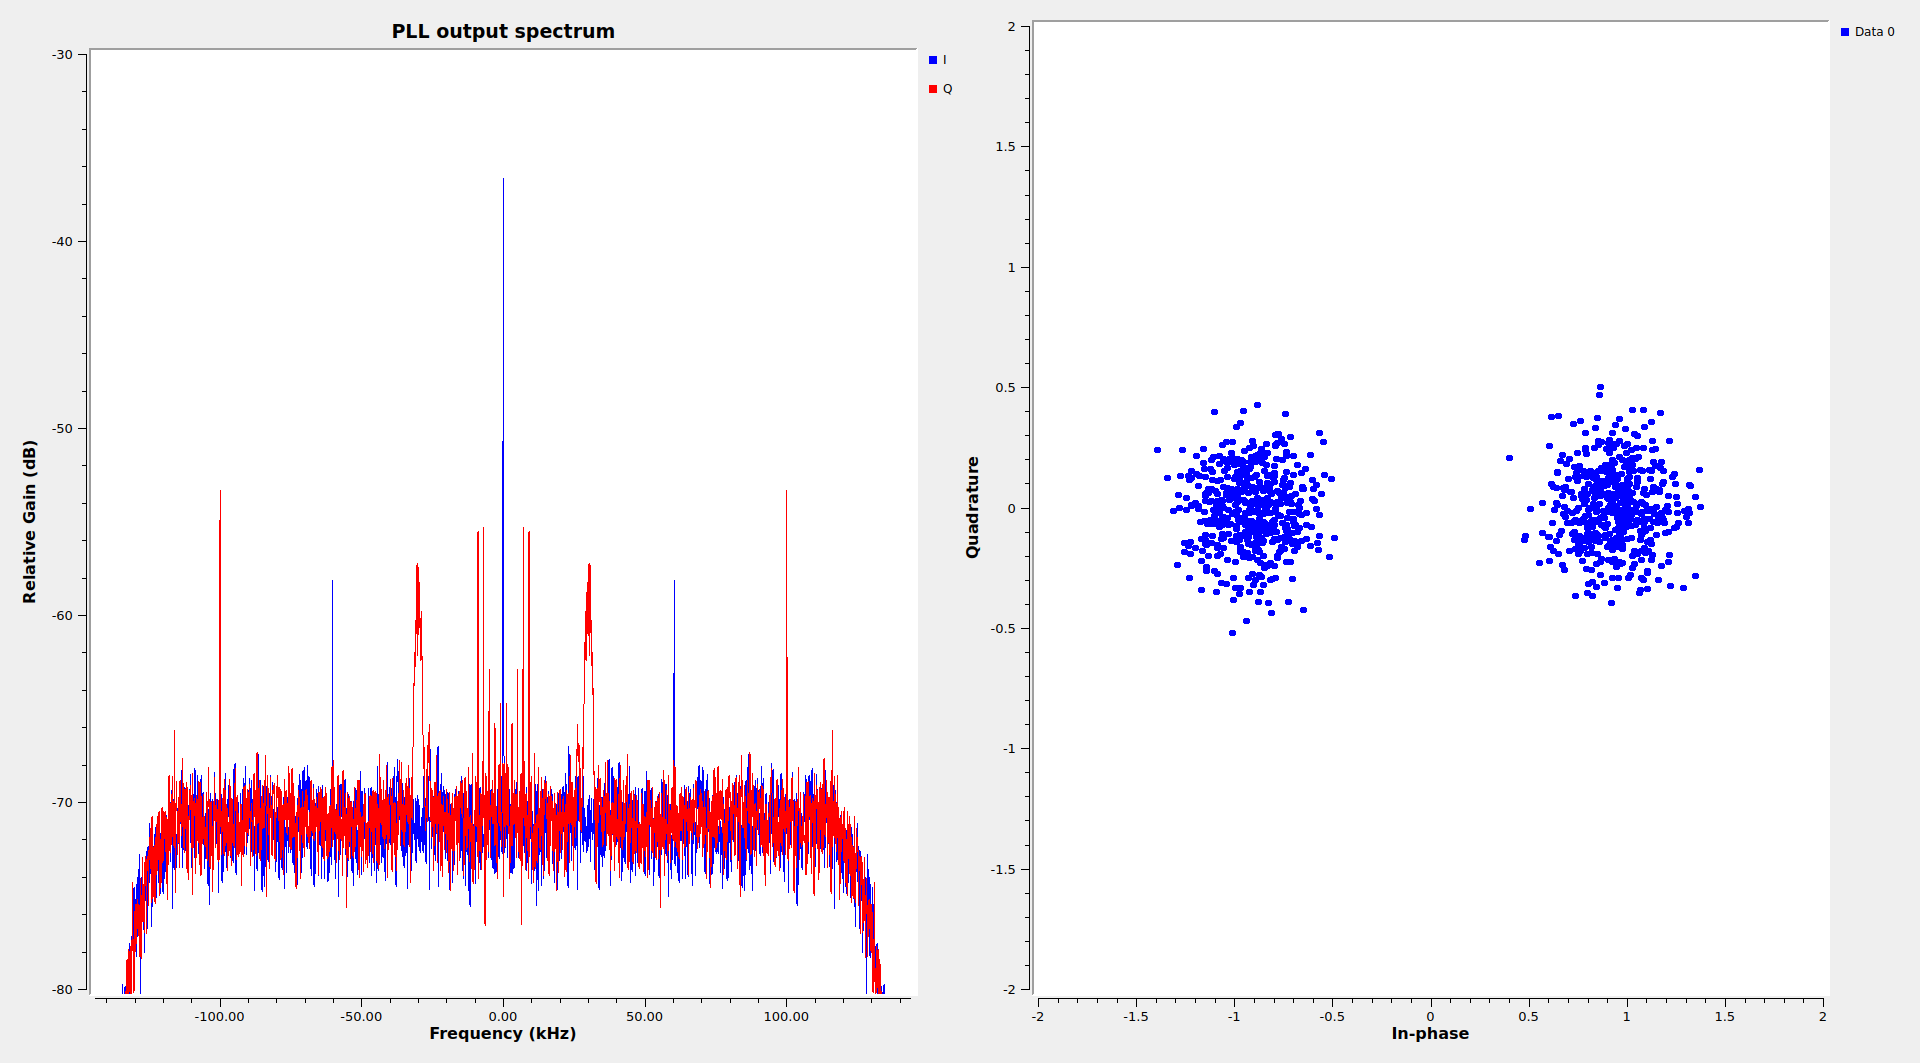
This is how the GUI of the flowgraph looks like when running on the recording. The SNR is excellent, and the constellation has no bit errors.
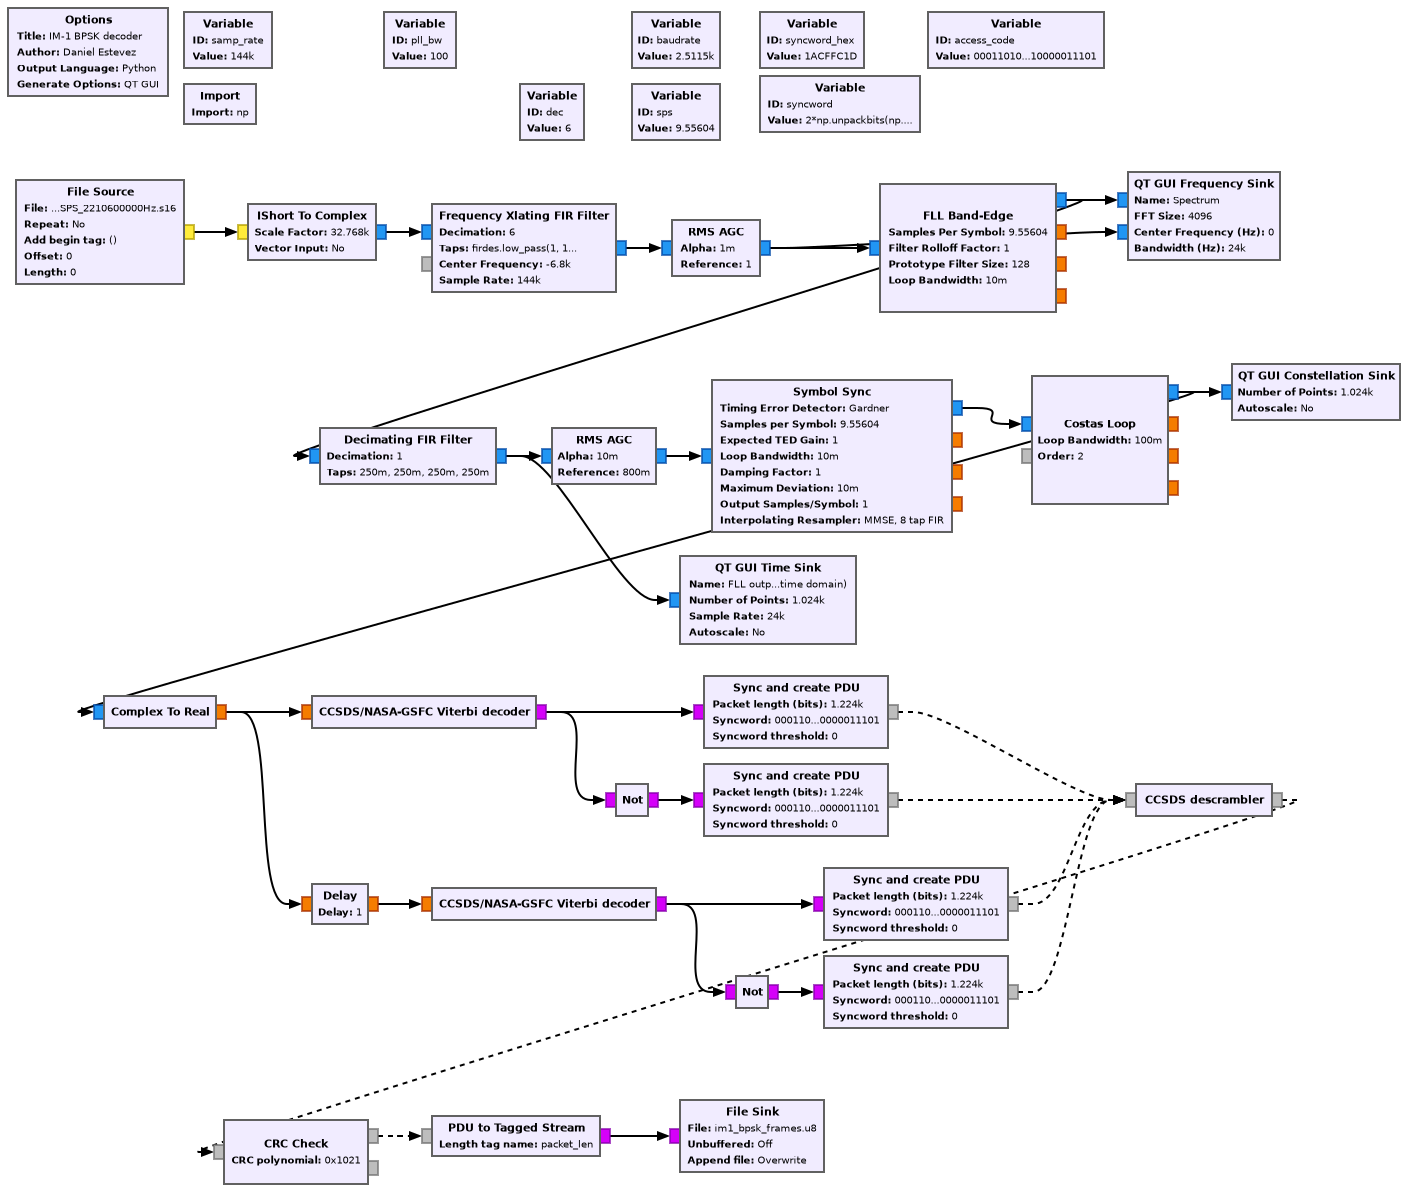
The following shows the flowgraph for decoding the suppressed-carrier BPSK telemetry. Since there is Doppler drift on the signal, the FLL Band-Edge block is used. There is something interesting about the demodulator, which is that the rectangular pulse filter is using only a 1/2-symbol window, instead of the 1-symbol window which is more common. The reason is that using a 1-symbol window gives a lot of inter-symbol interference. It seems that the transmitter is using some form of triangular pulse shape, instead of the rectangular pulse shape which is normally used in deep space missions.
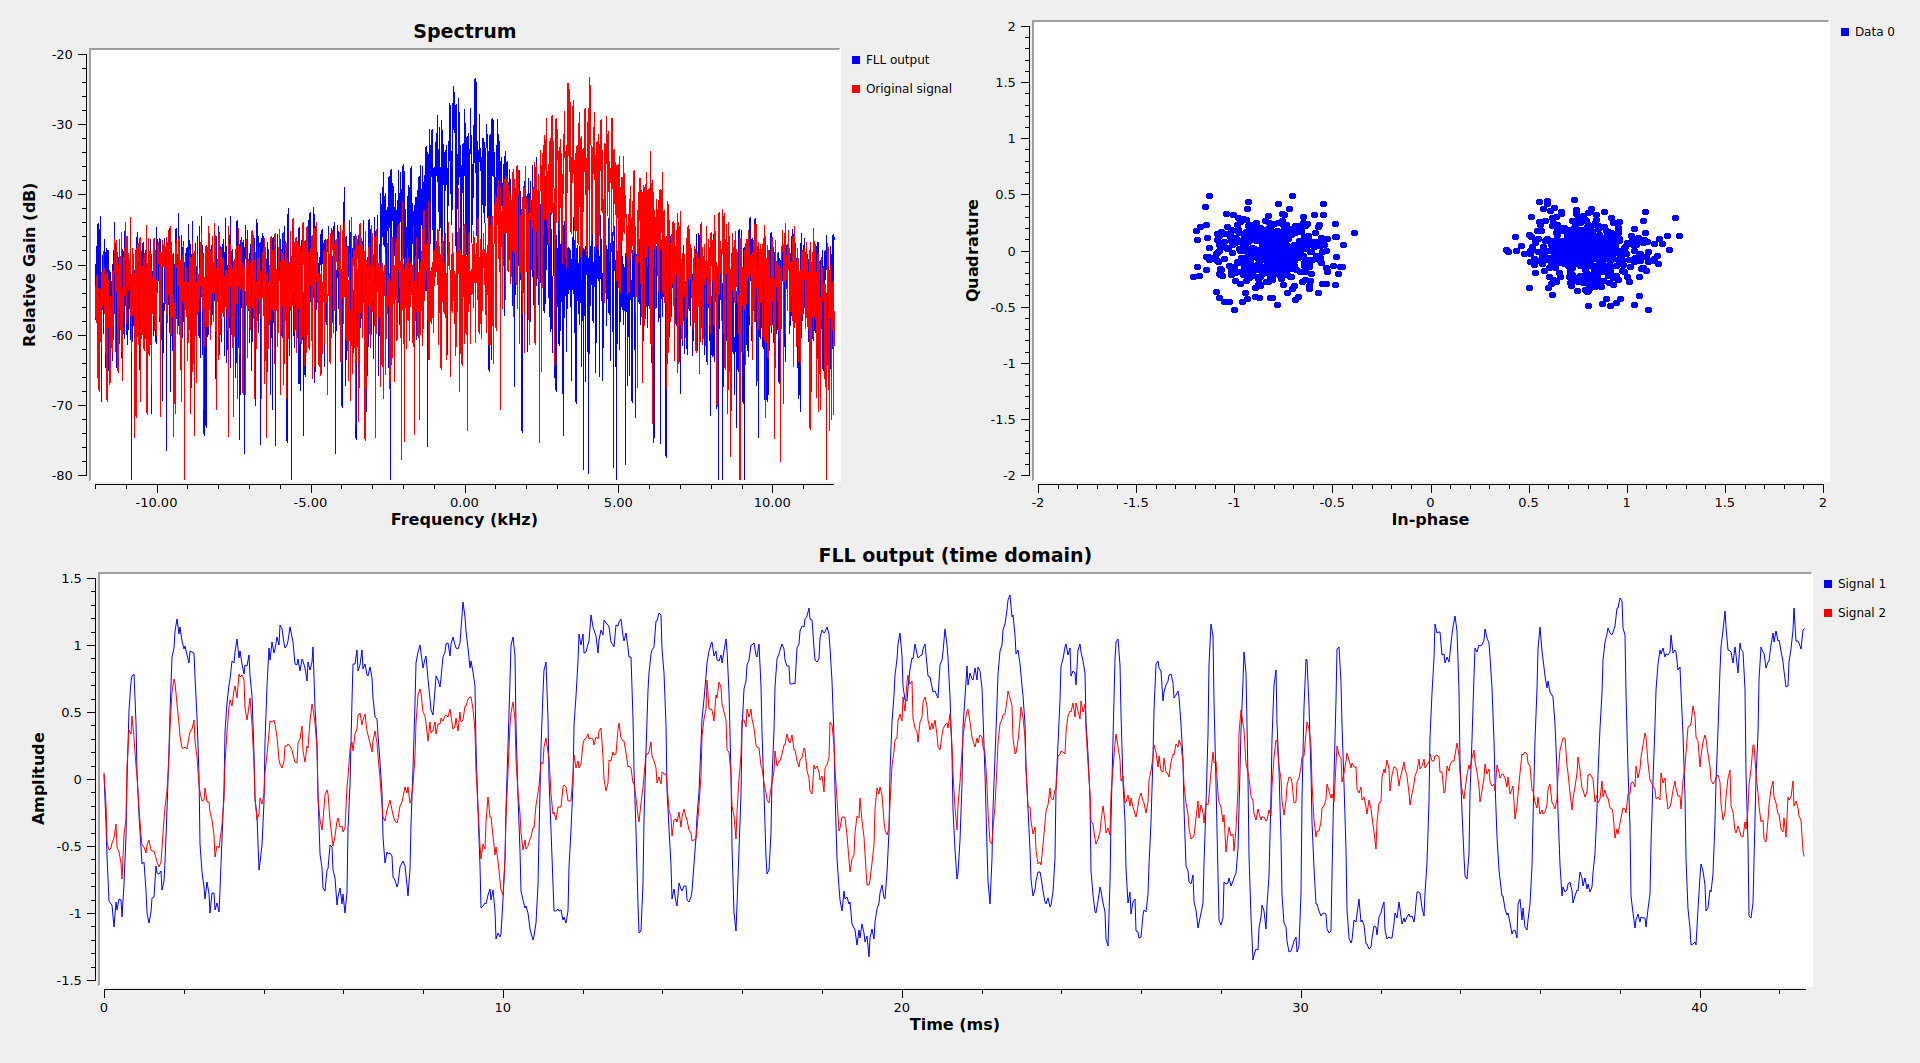
Here is the GUI of this flowgraph running on the recording from February 22. The SNR is again quite good. I have selected the part of the recording in which there is better SNR, as there are large changes in signal strength in this recording. The bottom panel shows the time-domain waveform. It is clear from this that the transmitter pulse shape is not rectangular.
The frames are 153-byte AOS frames. There is a Frame Error Control Field (CRC-16) which is checked by the GNU Radio flowgraph. Only virtual channel 1 is in use. The spacecraft ID is 0xCE. This does not appear in the SANA registry.
The following figure shows a raster map of all the AOS frames decoded from the first recording. The FECF has been removed from these frames already. There are two zones which are always zero. These show as dark purple bands in the plot. The first zone is the space where there would usually be an M_PDU header. All zeros is a valid value for an M_PDU header, which indicates that the first packet starts at the beginning of the packet zone (first header pointer equal to zero). The second zone is the space where there can be an Operational Control Field carrying a CLCW. In this case the CLCW is probably missing, since CLCWs typically have some non-zero bits.
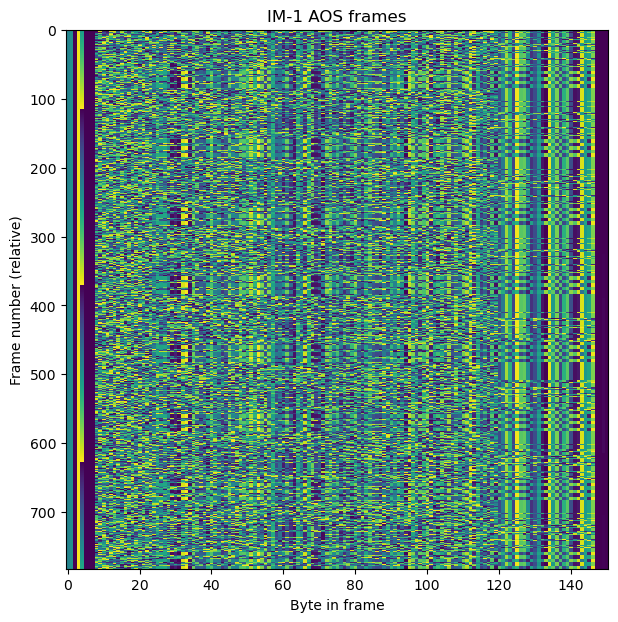
The payload in the frames looks quite random. In fact, the FCC documentation says that the data is encrypted. However, there are some patterns also. These probably correspond to padding data used to fill up the rest of the AOS frame when there isn’t more data to send immediately.
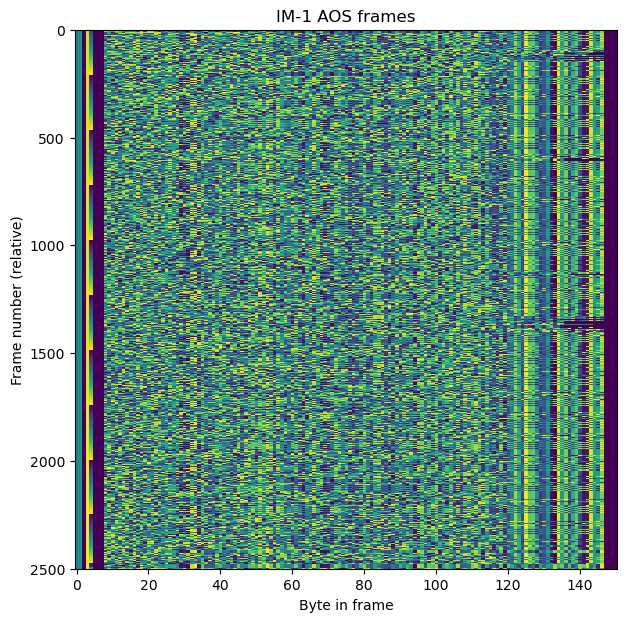
The raster map of the frames decoded in the second recording looks very similar.
The GNU Radio flowgraphs and the Jupyter notebook used in this post, as well as binary files containing the decoded frames, can be found in this repository.
One comment