Tianwen-2 is a Chinese mission that will return samples from the Earth quasi-satellite asteroid 469219 Kamoʻoalewa and rendezvous with the 311P/PanSTARRS comet. It was launched on 28 May 2025 from the Xichang Satellite Launch Center. It is planned to perform its orbital insertion at Kamoʻoalewa on 7 June 2026, and study the asteroid until 24 April 2027. Since ephemerides for this mission are not publicly available, it has been difficult for amateur observers to track it so far, but now it is close enough to Kamoʻoalewa to find it by pointing around the asteroid.
On Monday, CAMRAS used the 25 meter Dwingeloo radio telescope to receive and record the X-band telemetry signal from Tianwen-2, publishing the SigMF recordings in their data archive. They reported that the spacecraft was 1.1 degrees away from the asteroid. In this post I will decode and analyse the telemetry using these recordings.
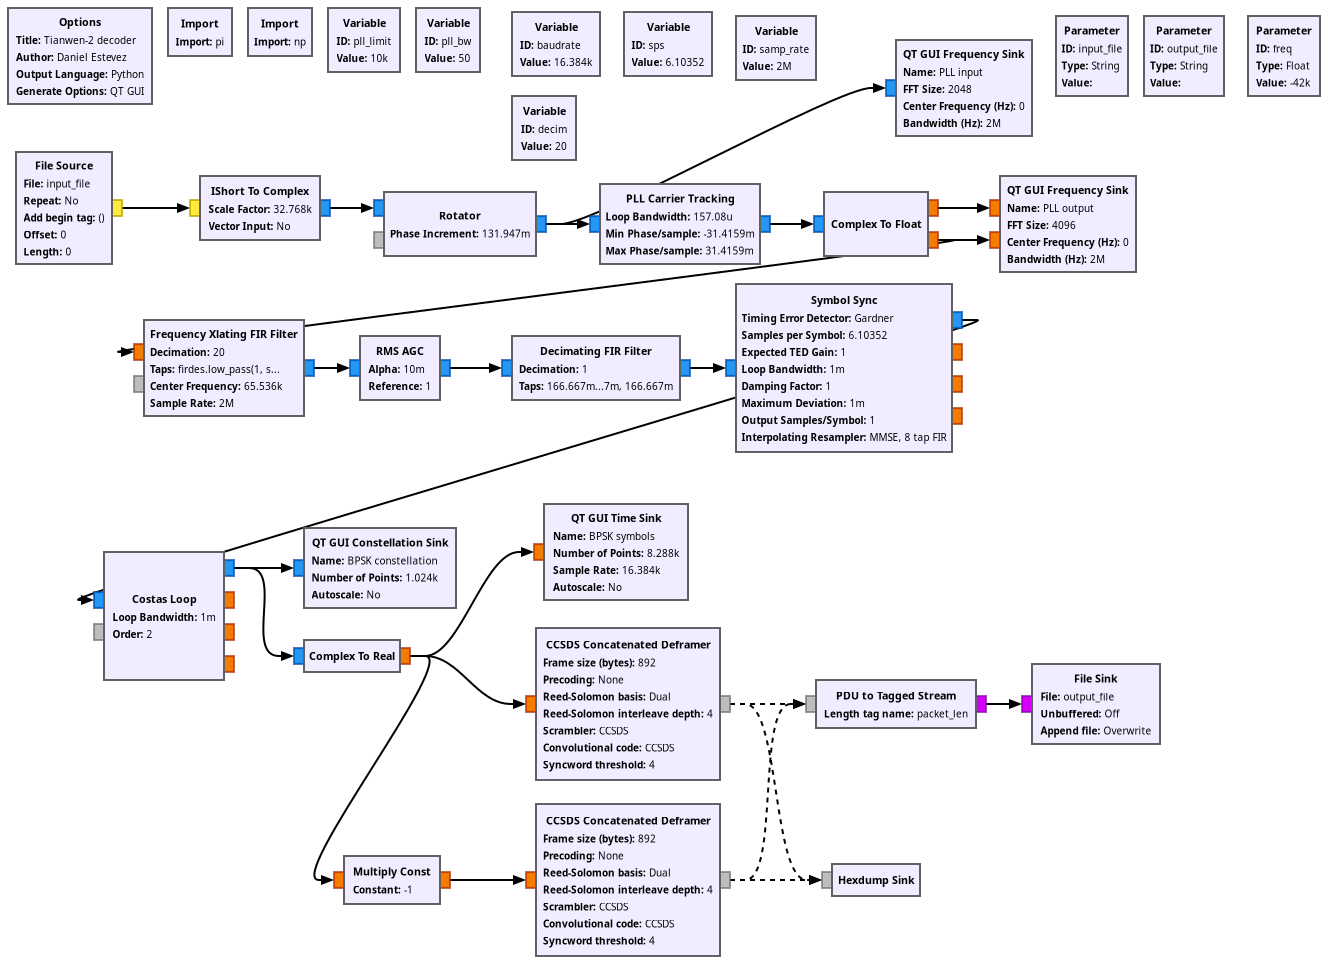
Tianwen-2 transmits X-band telemetry at 8428.19 MHz. The modulation is the same as Tianwen-1: PCM/PSK/PM with 16384 baud telemetry on a 65536 Hz subcarrier. The coding is slightly different from Tianwen-1. Whereas Tianwen-1 uses concatenated coding with an unusual frame size of 220 bytes instead of 223 bytes in order to have a frame duration of exactly 0.25 seconds, Tianwen-2 uses concatenated coding with a frame size of 892 bytes (four full interleaved Reed-Solomon codewords), which gives a frame duration of exactly 1 second.
This is a very minor but nice improvement. I understand the beauty of having a frame length that is a power of two, since the baudrates used by these spacecraft are also powers of two. However, the configuration used by Tianwen-1 is somewhat awkward because it has to omit 3 bytes from the Reed-Solomon codeword to obtain a 256-byte frame when including the 32-bit ASM. On the other hand, Tianwen-2 solves this in a cleaner way by using four interleaved codewords, which also increases the coding gain slightly.
I have used the following GNU Radio flowgraph to decode each of the Dwingeloo recordings.
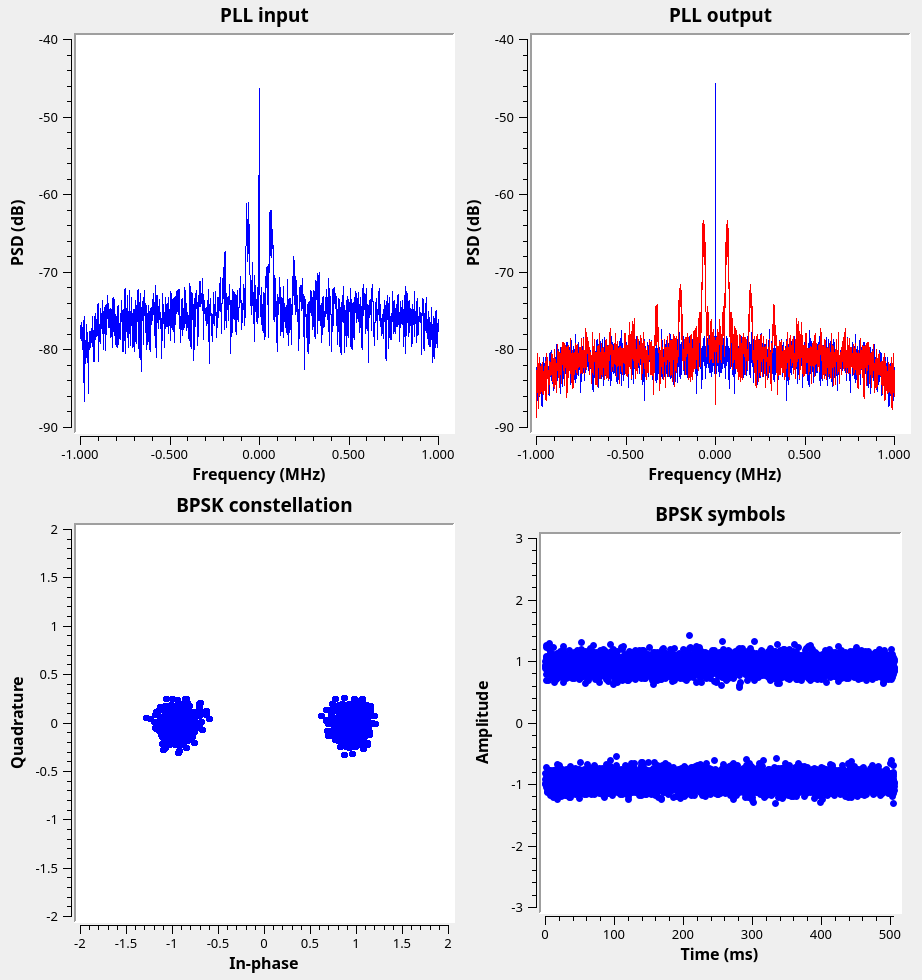
The following screenshot shows the GUI of this flowgraph while running on one of the Dwingeloo recordings. The SNR of these recordings is very high, so there are no bit errors.
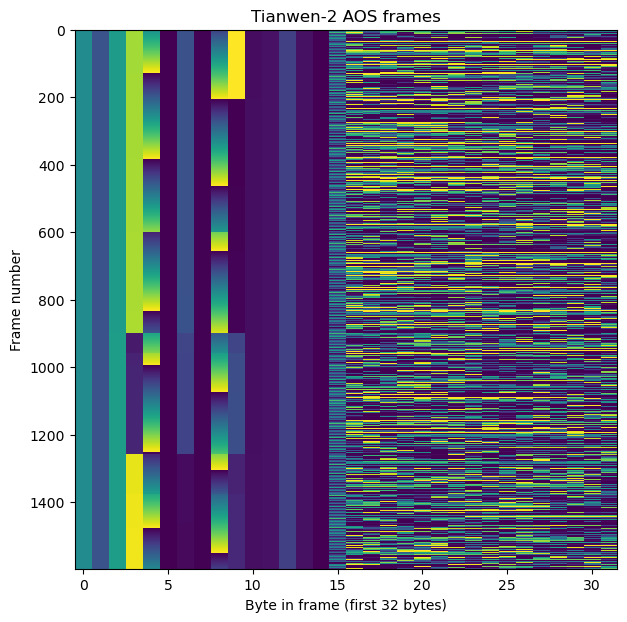
The telemetry frames are CCSDS AOS frames. There is no operational control field or frame error control field. The spacecraft ID is 0xed, which is assigned to Tianwen-2 in the SANA registry. Only virtual channel 1 is in use.
The following shows a raster map of all the AOS frames decoded from the recordings done at Dwingeloo on 25 and 26 May.
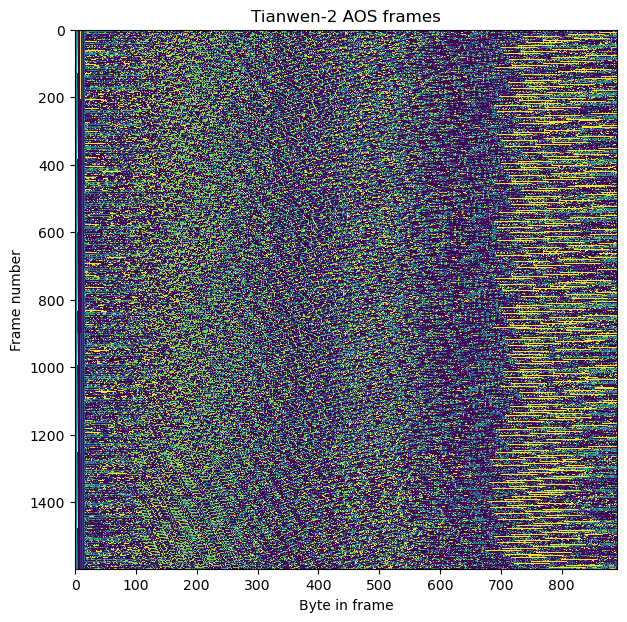
There is an 8-byte transfer frame insert zone, but I don’t know what its contents mean. Most of the bytes in the insert zone are static, others change occasionally, and one of the bytes seems to be a frame counter. It is definitely not a timestamp, which is what Tianwen-1 carries in its insert zone.
The following shows a detail of the first 32 bytes of each frame. The first 6 bytes are the AOS header. Bytes 6 to 13 are the insert zone.
Virtual channel 1 carries CCSDS Space Packets using M_PDU. There are a couple dozen different APIDs in use, and each APID carries packets of a fixed length. The Space Packets do not carry a secondary header. A secondary header is commonly used to carry the packet timestamp, but in this case I haven’t found any timestamps in the telemetry. Therefore, I am using the virtual channel frame count as a coarse timestamp.
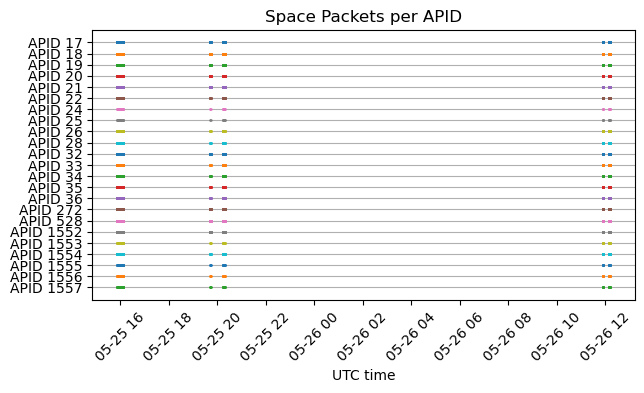
The following figure shows that the same APIDs are active all the time.
Here is a raster map of the payloads of the Space Packets in one of the busiest APIDs. The Jupyter notebook contains a plot like this for each APID.
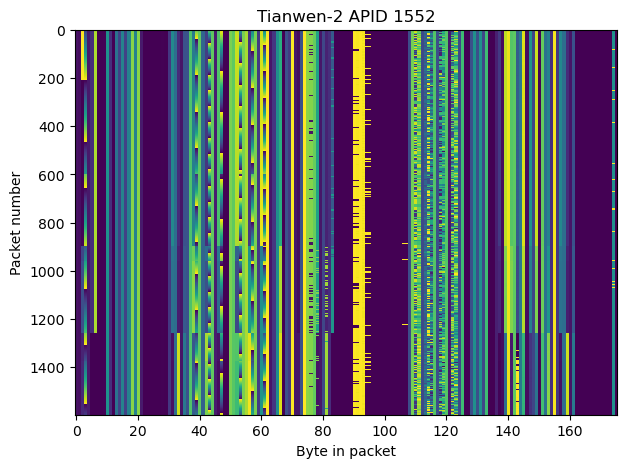
I haven’t found much of interest in the telemetry. Actually, it seems that there isn’t that much. The Space Packet sizes are around 100 to 200 bytes, and most values are quite static. In the Tianwen-1 telemetry I was able to find state vectors and ADCS data, but here I cannot see anything like that.
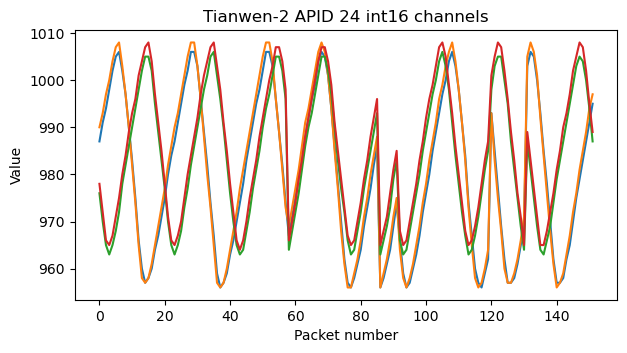
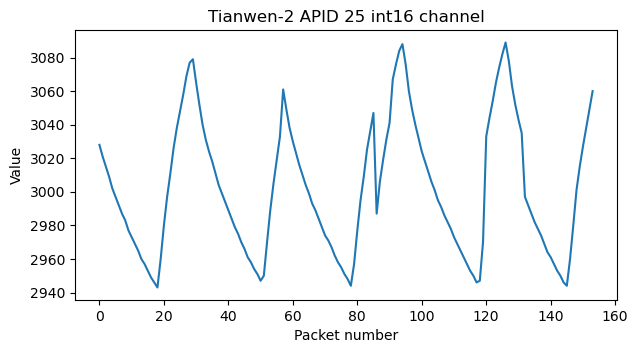
I have plotted a few telemetry channels for which I’m reasonably confident about their data format. Here I show a couple of the most interesting ones. The Jupyter notebook contains the rest. These plots contain the concatenation of the data from all the recordings, so the discontinuities are just due to time discontinuities.
First, here are four channels that show some kind of oscillatory behaviour.
Next, here is one channel that clearly shows periodic exponential decays. This might be the temperature of a component that is kept within a certain range by a heater activated by a bang-bang controller.
Finally, here are four channels that have float32 values. The values are constant except for a small amount of noise. I don’t know what these are. I don’t think they are quaternions, since they don’t have unit norm.
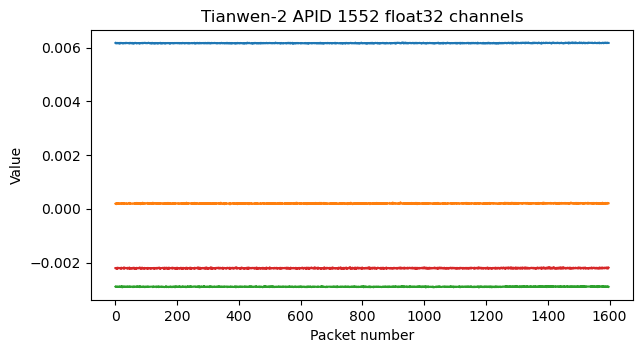
Perhaps some of the spacecraft’s systems are still on sleep mode. It will be interesting to see if more telemetry shows up when the orbit injection begins.
The code and data used in this post is in this Github repository. This contains the GNU Radio decoder flowgraph, the Jupyter notebook with the telemetry analysis, and the files with decoded frames.
Daniel,
Thanks for explain and share your
nice analysis.
Regards
BP
If you would translate the packets into real time, we would have a better chance of understanding. Clearly the spacecraft or a part of it is rotating. This is either attitude gyro stuff and /or power stuff and/or solar position stuff. If power, these steep declines are due to panel shading. the “rotation” probably has to due with thermalyy controling the structure, why they move in and out of phase is because they are differenent sensors, but all react to spacecraft rotation..just not the same way…obviously. One part of the structure may not rotate, which would be the radar/optical sensor that detects the object of the rendezvous. All of this is in there. The rendezvous stuff will begin to show up…maybe the optics to, but that might be on another channel. Pretty cool what they are accomplishing.
you say you havent found much interesting I beg to differ. All those ramps are counting something in bit order from the low order bits to the high ones. You are looking at the spacecraft computer. Spend some time with it and you will get everything…local clock time, tank pressures, rendevous parameters…everything. You just havent worked hard enough. Then again, maybe the Chinese might just give it to you. By the way, the single blue plot is solar panel voltage, panels cover part of the rotating spacecraft body, thats why the voltage cycles like it does