Last year I wrote a post on July 23, which is the anniversary of Tiawen-1‘s launch. The post was essentially an updated plot of the orbital parameters of Tianwen-1’s remote sensing orbit. As I explained in that post, AMSAT-DL is using the 20 meter antenna in Bochum observatory to receive telemetry from Tianwen-1 almost every day (this can be followed in the YouTube livestream). Since Tianwen-1 includes its state vector (position and velocity with respect to Mars) in its telemetry, this allows us to monitor its orbit, which is of interest because no other public detailed information is available.
This year I completely forgot to do the same again for July 23, but I have remembered now. Here is the updated plot of the orbital parameters of Tianwen-1 since 8 November 2021, when the remote sensing orbit began. The plot includes data until 2 August 2024. During most of August, AMSAT-DL is not tracking Tianwen-1, since Mars has a very similar right ascension to STEREO-A, and tracking STEREO-A has priority. Tracking of Tianwen-1 will resume as the two objects drift apart in right ascension.
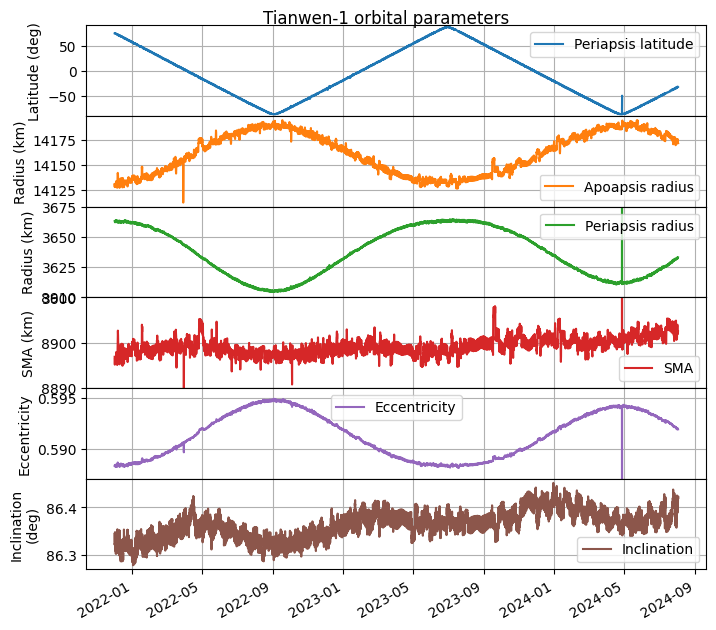
All the changes in the orbital parameters are due to perturbations by the Sun’s gravity and the oblateness of Mars, since as far as I know there have been no manoeuvres in this orbit. The main change in orbital parameters is a steady change in the latitude of the periapsis. The orbit is designed on purpose to exploit this effect. Over time, all the surface of Mars can be observed from a low altitude. This perturbation is related to a change in eccentricity, which is minimal when the periapsis is over the north pole and maximal when the periapsis is over the south pole.
Now it is quite apparent that there is also a slow but steady increase in inclination. This was not so evident last year, due to a sinusoidal perturbation that is also present, but now it is clear that the inclination has increased by about 0.05 deg since November 2021. It seems that this increase in inclination is related to a small increase in the semi-major axis.
The code for the updated plot can be found in this Jupyter notebook.
2 comments