This is a continuation of my series of posts about LTE. In the previous post we looked at the downlink cell-specific reference signals (CRS), transmit diversity equalization, and the demodulation of the PBCH (physical broadcast channel), PCFICH (physical control format indicator channel) and PDSCH (physical downlink shared channel). In this post we will look at the PHICH (physical hybrid ARQ indicator channel). As usual, I will be analysing the recording of a base station that I did in the first post about the LTE downlink.
The PHICH is used to send hybrid-ARQ ACK/NACKs to the UEs. Each PHICH transmission carries a single bit, either ACK (encoded by the bit 1) or NACK (encoded by the bit 0). Repetition encoding is used to increase the chances of correct decoding, and an orthogonal overlay code allows transmitting information for several UEs using the same resource elements.
The PHICH is transmitted in the control region of the subframe, which is formed by the first 1, 2, or 3 symbols of the subframe (according to the CFI value). As other control channels, the PHICH uses REGs. Recall that a REG is a set of 4 resource elements which are not used for the transmission of the CRS and which are adjacent in frequency if we ignore the resource elements used for the CRS. For instance, when 2 or 4 antenna ports are used for the CRS, in the first symbol of the subframe two resource elements in every block of 6 are used for the CRS. The other 4 resource elements form a REG. Therefore, there are 2 REGs per resource block. In symbols 2 and 3 there may not be resource elements allocated to the CRS, so there are 3 REGs per resource block in that case.
A PHICH transmission uses 3 REGs which are equally spaced over the bandwidth of the cell, in order to give frequency diversity. This is similar to the PCFICH, which uses 4 equally spaced REGs in the first symbol of the subframe. Depending on the configuration of a parameter called PHICH duration, the PHICH can either use the first symbol in each subframe (normal PHICH duration), or the first 2 or 3 symbols in each subframe (extended PHICH duration). Here we will only look at the normal PHICH duration, which is what is used in the recording. In the normal duration, the 3 REGs are transmitted simultaneously in the first symbol of the subframe. In the extended duration the 3 REGs are distributed over the first 2 or 3 symbols of the subframe.
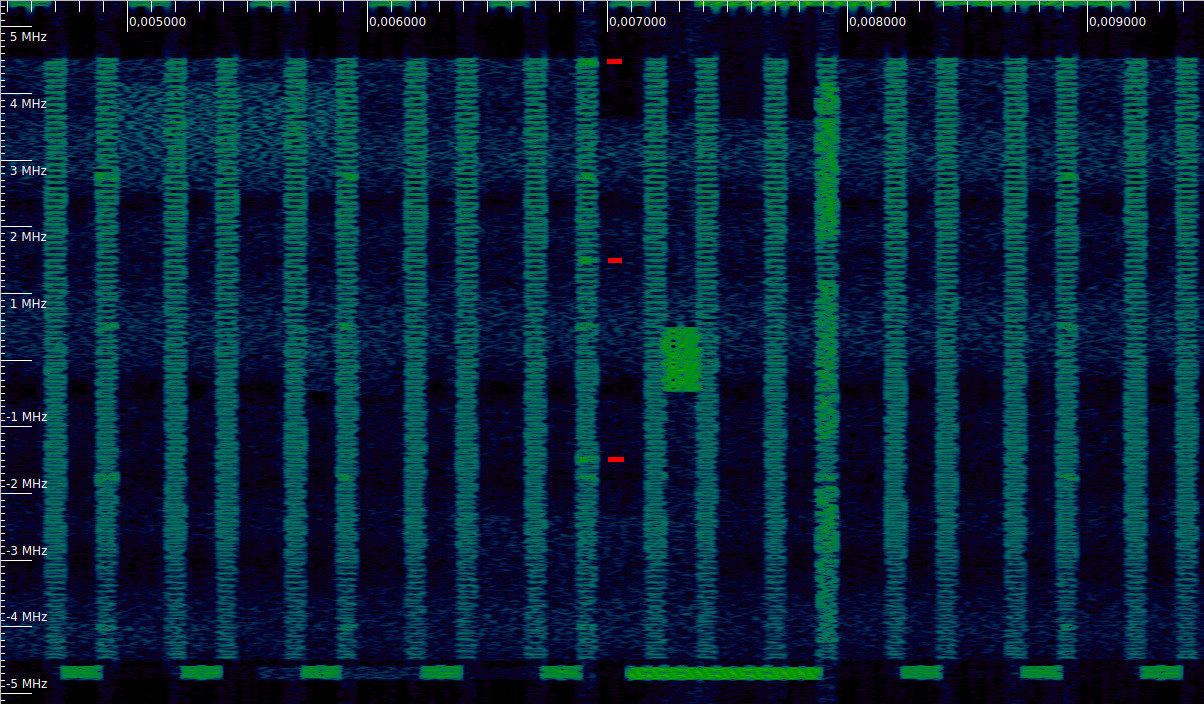
In the waterfall below we can see a PHICH transmission. In the first symbol of each subframe we can see the 4 REGs used by the PCFICH (the lower frequency REG, at around -4 MHz is barely visible). In the subframe near the centre of the image (which incidentally contains the synchronization signals), in addition to these 4 REGs, there are 3 more REGs in use, which I have marked with red ticks. These form a PHICH transmission.
Resource element mapping of the PHICH
The set of 3 REGs used by a PHICH transmission is called a PHICH group. The PHICH groups used by a cell are always allocated to the PHICH even when they are not used to transmit hybrid-ARQ ACKs/NACKs. Therefore, in the control region of a subframe, the 4 REGs in the first symbol used by the PCFICH, plus the 3 REGs used by each PHICH group are reserved for these purposes. The remaining REGs can be used for the PDCCH (physical downlink control channel). The different allocations depending on the configuration parameters can be explored with this online tool.
The number of PHICH groups used by a cell depends on a parameter \(N_g\) that is given in the MIB. For a normal cyclic prefix, the number of PHICH groups is \(N_{\text{PHICH}}^{\text{group}} = \lceil N_g N_{\text{RB}}^{\text{DL}} / 8\rceil.\) Here \(N_{\text{RB}}^{\text{DL}}\) stands for the number of resource blocks used in the downlink. In our case, we have a 10 MHz cell, which has 50 resource blocks. The parameter \(N_g\) can have the values 1/6, 1/2, 1, and 2, which in our case give 2, 4, 7, and 13 PHICH groups.
The REGs used by a particular PHICH group \(m = 0, 1, \ldots, N_{\text{PHICH}}^{\text{group}} – 1\) are defined in the following way. We denote by \(n_0\) the number of REGs in the first symbol of the subframe which are not used by the PCFICH. Typically we have \(n_0 = 2N_{\text{RB}}^{\text{DL}} – 4\), since there are 2 REGs per resource block, and the PCFICH uses 4 REGs. We number all these REGs from 0 to \(n_0 – 1\), in order of increasing frequency. The 3 REGs used by PHICH group \(m\) are, according to this numbering, \((N_{\text{cell}}^{\text{ID}} + m + \lfloor j n_0 / 3 \rfloor) \mod n_0\), for \(j = 0, 1, 2\).
The term \(\lfloor j n_0 / 3 \rfloor\) distributes the 3 REGs evenly across the cell bandwidth. The term \(N_{\text{cell}}^{\text{ID}}\), which is the PCI (physical cell ID), makes the location of the PHICH dependent on the cell, so that different cells will typically have the PHICH in different locations. The term \(m\) places all the \(N_{\text{PHICH}}^{\text{group}}\) groups in adjacent REGs, so that there are three “bands” in the cell bandwidth which are reserved for the PHICH.
I find interesting that the PCI only enters in this formula linearly, instead of in a more complicated way. The consequence of this is that when the PCIs of two cells are close (for instance, for cells in the same group the PCIs only differ by 1 or 2), most of the REGs allocated to the PHICH in both cells overlap. Perhaps it would be better to make the PHCIH allocations depend on the PCI more “randomly”.
The formulas above are only valid for the normal PHICH duration, which is simpler. For the extended PHICH duration, we need to take into account the fact that the number of available REGs in each symbol is different (because the PCFICH only uses the first symbol). The complete formulas which also cover the extended duration case can be found in Section 6.9.3 in 3GPP TS 36.211.
The figure below shows the RMS amplitude of each REG in the first symbol of each subframe, as some kind of waterfall. Time is represented by the horizontal axis, with 100 ms (100 subframes) per row, with a total of 1 second of data (there are 10 rows). Frequency is represented by the vertical axis, with the lower frequencies at the bottom. To obtain this plot, I have used transmit diversity equalization, since the PCFICH, PHICH and PDCCH use the same transmit scheme as the PBCH, which for this cell is transmit diversity on antenna ports 1 and 2, as we saw in the previous post.
We see four horizontal lines that are always present. These correspond to the PCFICH. There are blocks that appear and disappear across the whole cell bandwidth. These correspond to the PDCCH, which is only active sometimes. Even when the PDCCH is active across the whole cell bandwidth, there are three frequency bands which are unused (albeit one of them is split in two, with one part at the upper edge of the cell and another part at the lower edge of the cell, due to the modulo \(n_0\) operation). These three bands correspond to the PHICH regions. From the width of the bands we can determine that \(N_g = 1\), so there are 7 PHICH groups in this cell. Sometimes we see that one PHICH group is active.

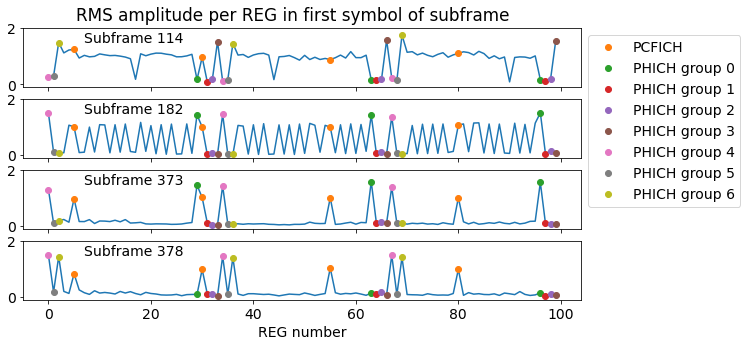
The next figure shows the RMS amplitude of each REG in the first symbol of a few subframes. The REGs allocated to the PCFICH and to each of the 7 PHICH groups have been marked with different colours.
In subframe 0 we can see that only the PCFICH is active. In subframe 3, the PDCCH is active in almost all the REGs, while the PHICH is inactive, leaving gaps in the spectrum. In subframe 6 the PDCCH is inactive, and there is one PHICH group active. Since during the recording the cell wasn’t serving many UEs, it is quite rare to see two or more PHICH groups active at the same time.
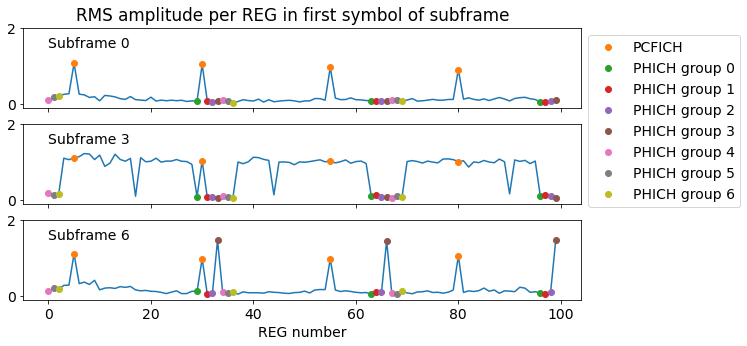
Interestingly, the amplitude of the PHICH is \(\sqrt{2}\), while the amplitude of the PCFICH, PDCCH, and other channels such as the PBCH is 1. I haven’t found the reason for this difference. Reading TS 36.211 my understanding is that all of them should have the same amplitude.
The following plot shows the RMS amplitude versus time of each PHICH group, using the same colour coding as in the plot above. We see that some PHICH groups are used more frequently than others. The PHICH group that is used for each UE depends on the index of the lower resource block of the corresponding uplink grant for that UE, so this can explain why the usage is concentrated in some of the groups.
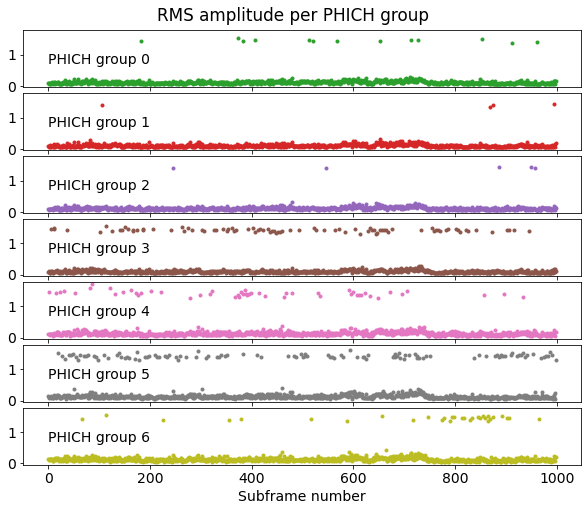
The total number of transmissions in each of the 7 groups during the first second of the recording is respectively 13, 4, 5, 87, 52, 114 and 31.
PHICH modulation and coding
Each PHICH group can support up to 8 simultaneous transmissions by using orthogonal sequences. The following 8 PHICH sequences are defined:\[(+1, +1, +1, +1),\\(+1, -1, +1, -1),\\(+1, +1, -1, -1),\\(+1, -1, -1, +1),\\(+i, +i, +i, +i),\\(+i, -i, +i, -i),\\(+i, +i, -i, -i),\\(+i, -i, -i, +i).\]Note that these 8 vectors are orthogonal over the real field. The first four are the Walsh basis of dimension 4, and the last four are obtained by multiplying the first four by \(i\).
To encode a PHICH transmission, first the ACK/NACK value is encoded in BPSK, using the constellation point \(-\sqrt{2}/2-i\sqrt{2}/2\) to represent the bit 1 (ACK), and \(\sqrt{2}/2+i\sqrt{2}/2\) to represent the bit 0 (NACK). We denote this constellation point by \(z\). One of the 8 orthogonal sequences above is chosen and multiplied by \(z\) to yield a vector of 4 symbols. Such a vector is repeated 3 times and concatenated to obtain 12 symbols.
The 12 symbols are then scrambled by muliplication with a sequence of 12 values in \(\{\pm 1\}\) that is generated pseudorandomly depending on the PCI and number of subframe in the radio frame (this sequence is generated in the same way as for scrambling the PCFICH).
The 12-symbol vectors for all the transmissions of the same PHICH group are added together (up to 8 transmissions using different orthogonal vectors are supported simultaneously), and mapped to the 12 resource elements in the 3 REGs occupied by the PHICH group.
In reception, the UE gathers the 3 REGs of the PHICH group, applies the 12-bit scrambling sequence, and then projects each of the 3 REGs onto the desired 4-element orthogonal sequence. The 3 resulting complex numbers are averaged together to obtain the final symbol (the 3 REGs contain the same information except for the fact that they are scrambled differently). Finally, since the transmission is BPSK, this resulting complex symbol is projected onto the diagonal that joins \(1+i\) and \(-1-i\). This projection is what separates orthogonal vectors such as \((1,1,1,1)\) and \((i, i, i, i)\) (these are orthogonal over the real field, but not over the complex field).
The figure below shows the result of this demodulation. We have filtered according to the amplitude to discard combinations of PHICH group and sequence which are not in use. We see that most of the values are negative, corresponding to ACKs, as would be expected. There are only 4 NACKs.
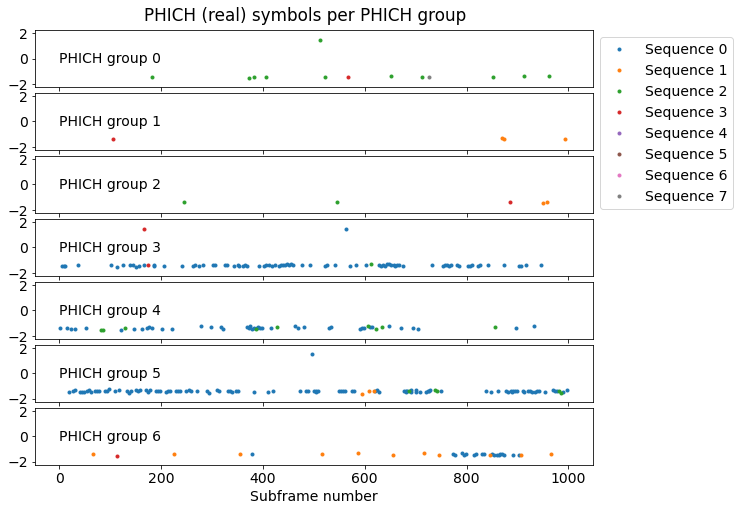
The sequence 0 is the most commonly used by far. The higher 4 sequences (which are the ones that use the complex number \(i\)) are used rarely in this case. There is only one such transmission: in group 0 corresponding to sequence 7. The sequence number is also chosen in terms of the lowest resource block granted to the UE, so in other cases the relative usage could be different.
In this case, there are very few (only 12) subframes where several PHICH groups are used simultaneously. The figure below shows the first four cases. Moreover, there are no cases in which two or more sequences are used simultaneously in the same PHICH group.
We can plot constellation diagrams for each PHICH group and pair of sequences \(k\) and \(k+4\) (recall that these two sequences only differ in a multiplication by \(i\)). These are obtained by descrambling each PHICH group and projecting onto each of the first 4 sequences. The transmissions for the sequence \(k\) with \(k < 4\), would show up at the constellation points \(\pm(1+i)/\sqrt{2}\) (or actually \(\pm(1+i)\) due to the fact that the amplitude is \(\sqrt{2}\) as I have remarked above), while the transmissions for the sequence \(k+4\) would show up at the constellation points \(\pm(1-i)/\sqrt{2}\).

We can again see that most of the constellation points are at \(-1-i\), corresponding to ACKs for sequences \(k\) with \(k < 4\). In group 0, sequences 3 and 7 there is a point at \(1-i\), which corresponds to sequence 7. This is also an ACK.
Code and data
The calculations and plots in this post have been done by extending the Jupyter notebook used in the previous post, since all the code for channel estimation and transmit diversity equalization is reused. The updated notebook can be found here. The relevant part is at the end of the notebook. I have added sections so that the long notebook is easier to follow.
The recording is the LTE_downlink_806MHz_2022-04-09_30720ksps SigMF recording in my LTE recordings folder.
Good stuff. Keep posting!