Scott Tilley VE7TIL is making a serious effort and a great job of recording and processing LES-5 telemetry. He is recording all the passes over his home in western Canada (which last several days, due to the sub-synchronous orbit), and sharing the data on a Github repository, together with Jupyter notebooks that analyse the data and plot some of the telemetry variables, such as the values recorded by the RFI experiment.
I am storing this data in InfluxDB 2.0 and using Grafana to plot it and explore it. The Grafana server has been running for quite some time now, but I never announced it publicly, so very few people have used it. I guess that now is a good time to share it with a wider audience. Update: this Grafana server is not running any more.
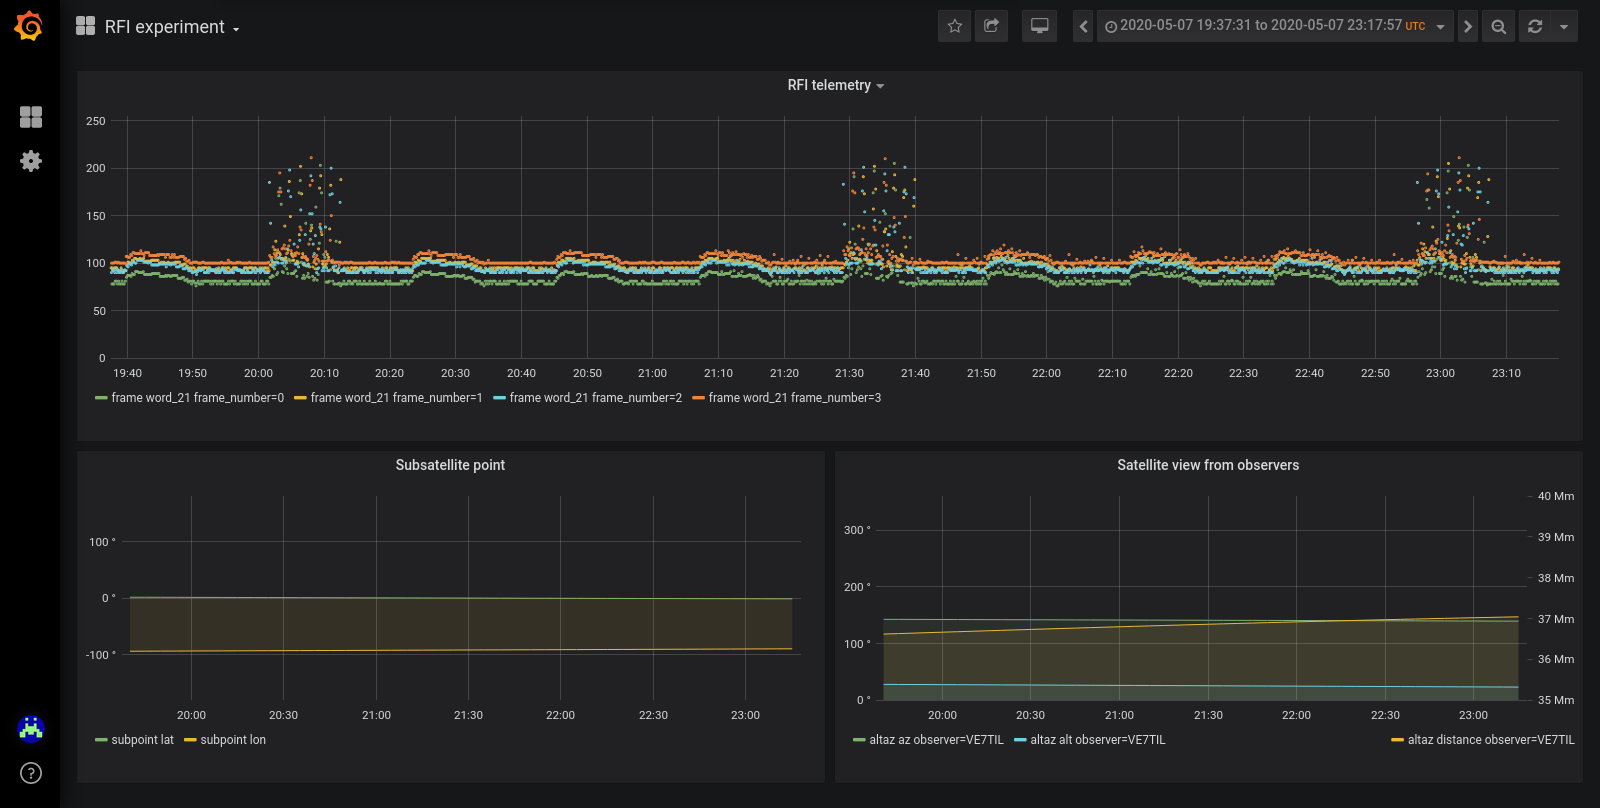
Here are some examples of what can be done with those dashboards. Perhaps the most important dashboard is the RFI experiment dashboard, and example of which can be seen here, which shows a dashboard as in the figure below.

In the upper pannel of the dashboard we can see the values reported by the average power RFI experiment telemetry words. The experiment alternates between command receiver (fixed frequency), frequency sweep, and frequency sweep with markers, as described in this post. The panels below show the subsatellite point, to help correlating observations with possible terrestrial transmitters in the satellite footprint, and the location of the satellite with respect to Scott’s station, to show in which part of the pass we are.
There are some interesting patterns that can be seen with this dashboard. For example, this link (shown in the figure below) shows a time interval (before 21:10) where the RFI experiment is receiving no signals and a time interval (after 21:10) where the RFI experiment seems to be receiving some weak signals. These are believed to be related to the SDS HEO satellites.
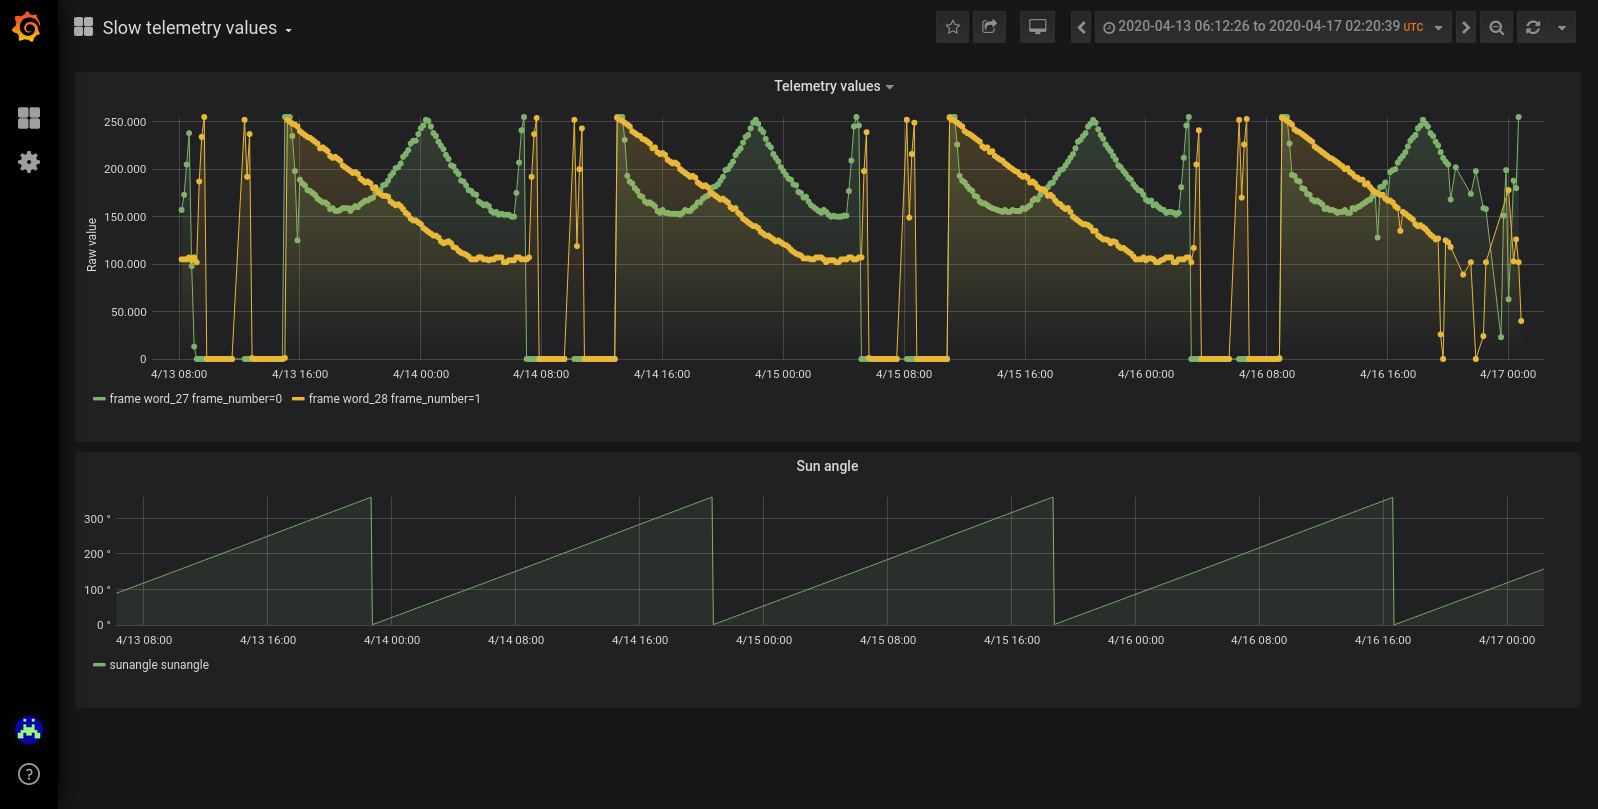
Another dashboard shows a pair of telemetry values that change quite slowly and seem to depend on the sun angle in a very precise manner. This suggest that they are sun sensors or something similar.
Finally, for people interested in playing and exploring the data, the telemetry exploring dashboard can be used to select and plot any number of the 96 different telemetry words that LES-5 transmits. This can reveal which of the words have bitfields, which have analog data, and also any interesting patterns that emerge in the data.
With this, I want to try to engage more people in looking at the LES-5 telemetry and see what we can find. If you are really interested in working with the data and adding new dashboards, please drop my a line and I can give you edit access to the Grafana server.
Really interesting article and i want to look at the Grafana Dash….unfortunately, the credentials given in the article are no longer valid 🙁
Hi. Sorry, the Grafana dashboard is no longer running (the Grafana server is being used for something else instead).
Thanks for quick reply.
That’s cool , I totally understand. Wish I stumbled across this earlier,
Appreciate all your work- it’s fascinating to read!