In previous posts, I have talked about the attempts of decoding LES-5 telemetry done by Scott Tilley VE7TIL and me. Now Taylor Bates KN4QGM has joined us in our efforts, and with their help I think I have figured out most details of how the telemetry of the RFI experiment works. One of the payloads of LES-5 was a radio frequency interference experiment that scanned the 255-280 MHz band and made spectrum measurements. The receiver of this experiment was also used as the telecommand receiver for the spacecraft. We are very interested in studying the telemetry of this RFI experiment to see to what extent the receiver is working and if the spacecraft could actually receive commands.
There are two articles that Scott found that have been very helpful in doing this work. The first one is “LESTR-2 Telemetry Ground System“, a technical report about LESTR-2, which was a telemetry receiver for LES-5 and LES-6. Even though this document doesn’t have a full description of the telemetry format, it describes in enough detail the structure of the frames and how synchronization works. The second is “The Results of the LES-5 and LES-6 RFI Experiment“, which is a technical report that describes the RFI experiment in detail and some results that were obtained with it. This report doesn’t speak at all about the telemetry, but knowing that all the RFI measurements are transmitted in the telemetry, it gives us information about what this data should look like.
Frame synchronization
The frame structure of LES-5 can be seen in the figure below, taken from the LESTR-2 report. Note that LES-5 and LES-6 have some differences. Data is organized in 8 bit words. A frame is formed by 32 words. The first and last word in each frame are used for synchronization. The rest of the frame is organized in six groups of four data words followed by a parity word used for error detection in the preceding data words. Frames are grouped in formats of four frames, and formats are grouped in groups of 16 formats (64 frames).
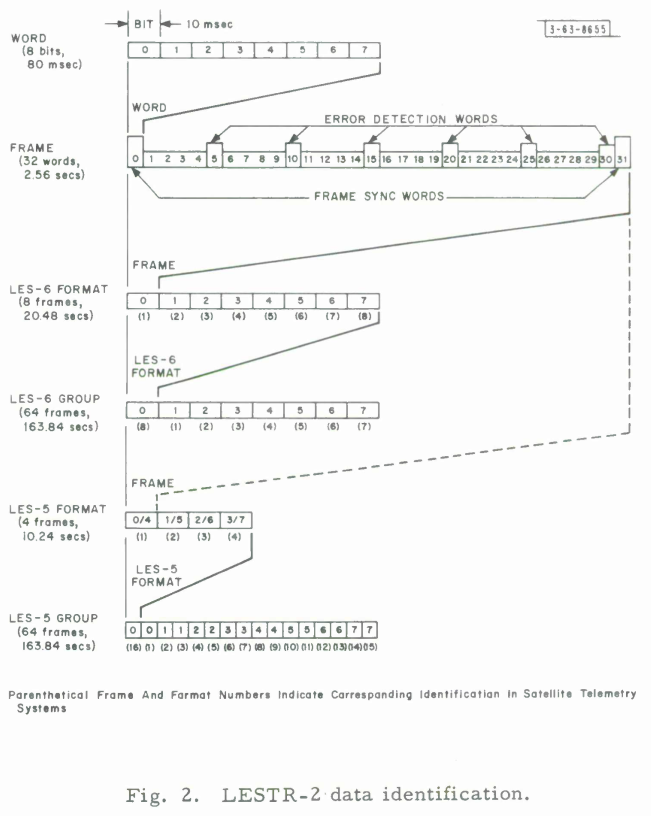
The value of the synchronization words is also included in the LESTR-2 report. Even frames have 01001001 in word 0 and 00011100 in word 31, while odd frames have the inverted patterns (10110110 in word 0 and 11100011 in word 31).
The frame numbering, in the case of LES-5, can be obtained from the value of word 2. The LESTR-2 report mentions that a value of 01000000 in this word indicates frame 0. However, from looking at the data, we see that indeed the frame number can be obtained from bits 4 and 5 in this word, which form a binary counter than counts up from 0 to 3. According to the LESTR-2 report, the start of a group can be recognised because word 7 in frame 0 has the value 11110100. This information is enough to synchronize and classify frames according to the figure above.
Working in parallel, Taylor and I made some Python code to synchronize LES-5 frames from the data that Scott had recorded in the last days. Taylor’s work can be seen in a post in the Riddles in the Sky blog, while my Python code is here.
My Python code boils down to a generator that, given an iterator that produces input bits, will yield frames. The generator has two states, unsynchronized and synchronized. In the unsynchronized state, it tries to synchronize to a pair of consecutive frames by looking at the sync pattern in words 0 and 31 of one frame and the inverted sync pattern in words 0 and 31 of the next one. This synchronization method is mentioned in the LESTR-2 report and reduces false positives.
In the synchronized state, the generator tries to fetch 256 bits to get a new frame, checks that words 0 and 31 look like the sync pattern to check that we remain in sync (otherwise it passes to the unsynchronized state), and yields the frame.
RFI experiment
The most important information about the RFI experiment is in page 5 of the RFI experiment results report:
The receiver is designed to tune down from 283 MHz to 253 MHz in 256 steps of approximately 120 kHz each, dwelling at each step for 2.56 sec.
Now, at 100 baud, a 32 byte frame takes precisely 2.56 seconds to transmit. Thus, we see that there is exactly one RFI measurement step per frame. A whole sweep is then completed every 256 frames, which amounts to 4 groups, taking approximately 11 minutes.
There are two values measured for each step: average power and peak-to-average power ratio. The average power is measured in a bandwidth of approximately 120kHz, while the peak power is measured in a bandwidth of 600kHz. This causes an interesting effect where a strong CW tone outside of the average power measurement bandwidth but inside of the peak power measurement bandwidth will cause a very large peak-to-average reading. The report mentions that there is an M shape due to this effect when a strong CW tone is swept by. Indeed, the noise floor causes moderate peak-to-average readings, then we get a very large reading when the tone enters the peak measurement, and then a low reading close to 0dB when the tone is present both in the average and peak measurement bandwidths.
Usually, the meaning of a particular word in a frame depends on which of the four frames in the format that word appears in. This causes a strong autocorrelation at a lag of 1024 bits (the length of one format) that I observed in my first post, rather than at a lag of 256 bits (corresponding to one frame). However, since there is one RFI measurement step per frame, it is most likely that there are two telemetry words with the average and peak-to-average readings in each frame, regardless of the frame’s position in the format.
Taylor observed that words 21 and 26 in each frame have patterns that repeat every approximately 11 minutes. However, he treated each of the frames separately. In a previous post I noticed a slow and a fast sawtooth in some of the bits of the format. It turns out that these are word 7 in frames 2 and 0 respectively. This can be seen in this Jupyter notebook, which tests the frame synchronization code. Upon a closer look, the period of the slow sawtooth turns out to be exactly 4 groups, or one sweep of the RFI experiment. These remarks are all key to understanding the RFI experiment telemetry.
According to the report, the frequency sweep is done downwards, starting from 283MHz and ending at 253MHz. The sawtooth also sweeps downwards, so I think it is some kind of sweep variable indicating the frequency in which the sweep is currently dwelling.
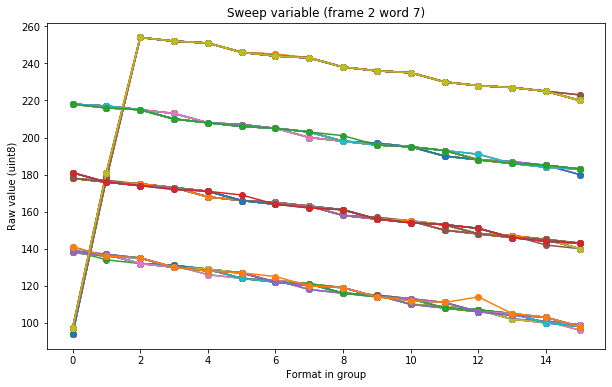
There is a detailed explanation about my current understanding of the RFI experiment telemetry in this Jupyter notebook, so here I will only do a summary. As shown below, the value of word 7 in frame 2, which I call the “sweep variable”, sweeps down over the course of 4 groups of 16 formats. The lowest point in the sweep coincides with the start of one of the groups. On next format, it has a value of approximately 180 as it sweeps back up to start again. On format 2 in this group it starts sweeping down, and continues doing so over the course of four groups until it reaches the bottom again. Interestingly, the values of the sweep variable are not particularly stable and change slightly on each sweep (more on this later).
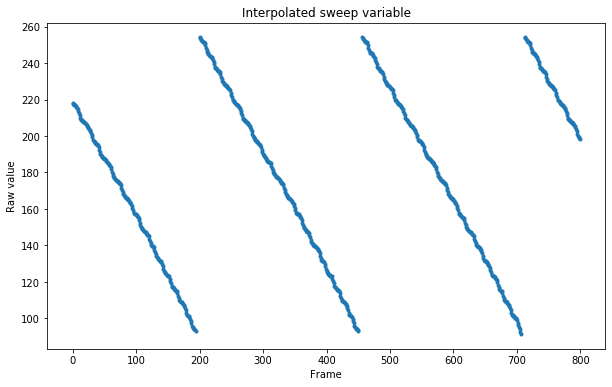
My idea is to plot the values in words 21 and 26, which I am pretty confident that correspond to the average power and peak-to-average ratio respectively, against the value of the sweep variable. However, words 21 and 26 appear in every frame, while the sweep variable appears only once per format, in frame 2. Thus, I have done some kind of interpolation of this variable to assign a value of the sweep value to each frame. I have also broken up the sweeps by detecting when the sweep variable “rewinds” upwards. In this way I can easily plot individual sweeps by separate.
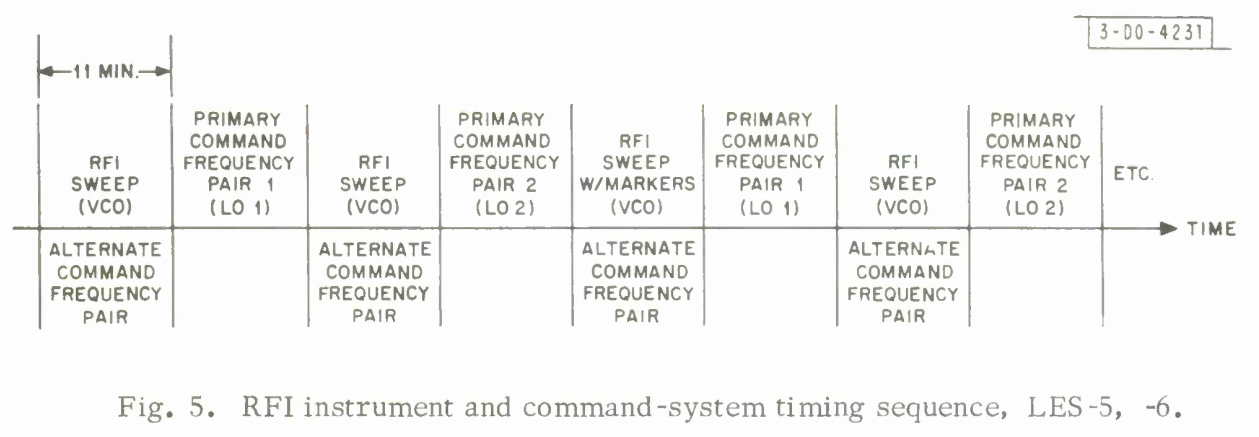
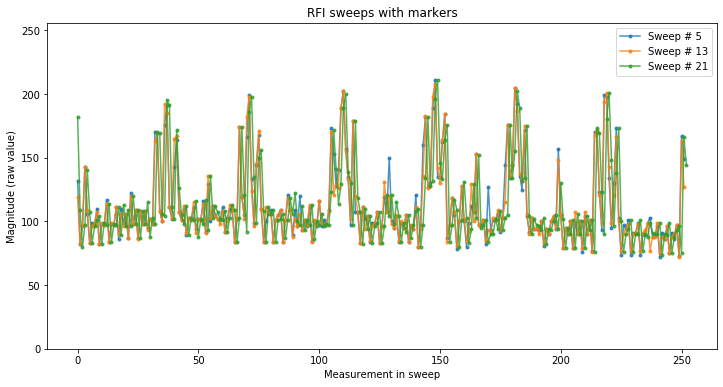
Next I plot the values of words 21 and 26 in each sweep. We see three different behaviours. This can be explained by the schedule of the use of the RFI instrument, shown in the figure below.
Sweeps with number 5, 13 and 21 (of course the start of the sweep numbering is arbitrary, but note that these happen every 8 sweeps) show some spikes at a more or less regular spacing across the spectrum. The peak-to-average measurement shows the typical M shape that happens when sweeping by a strong CW carrier (note that the value of this variable is inverted and it looks like a W instead).
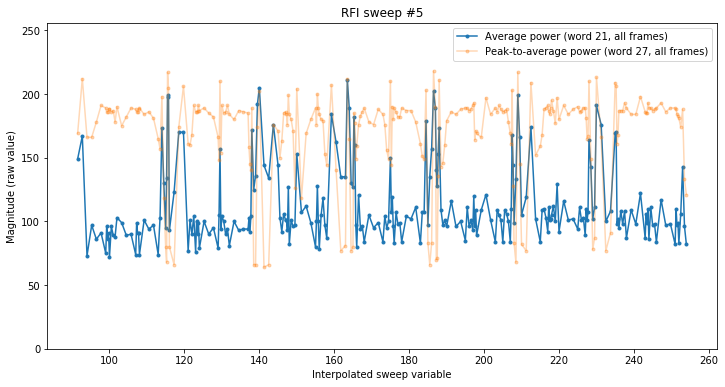
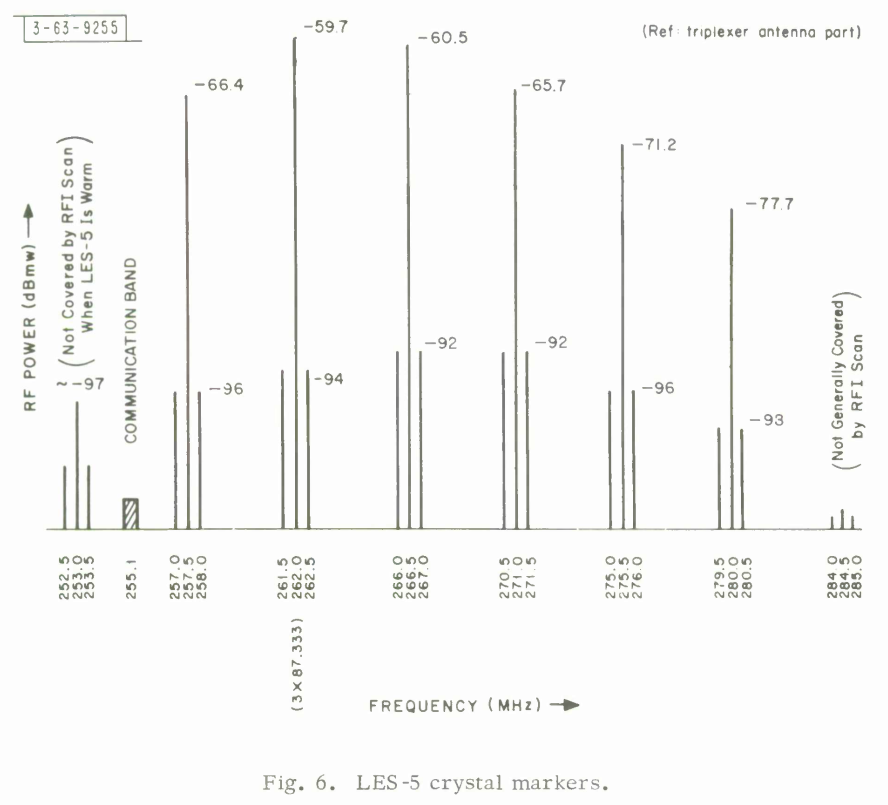
My interpretation is that these are the crystal frequency markers that were used for in-flight calibration of the RFI receiver in frequency and power. A set of crystal oscillators with the frequencies and powers shown in the figure below were coupled to the signal coming from the antenna via a 3dB hybrid. The powers shown are the equivalent powers referred to the antenna terminal. As the signal from the antenna went through an amplifier, the actual power of the crystal markers was much larger than shown below. The crystal oscillators were enabled every 8 sweeps.
In the telemetry data we see six groups of three tones that correspond to the six groups in the figure below. There are two tones near the edges that might or might not correspond to the two weaker markers in the edges of the figure below. There are also other weaker tones between the six main groups. These might be intermodulation products.
The remaining sweeps with odd number should correspond to RFI sweeps where the crystal markers are disabled. Only the noise floor is seen. It varies slightly across the spectrum and coincides with the noise floor of the sweeps with crystal markers. The lack of any visible signals in the spectrum will be treated later.
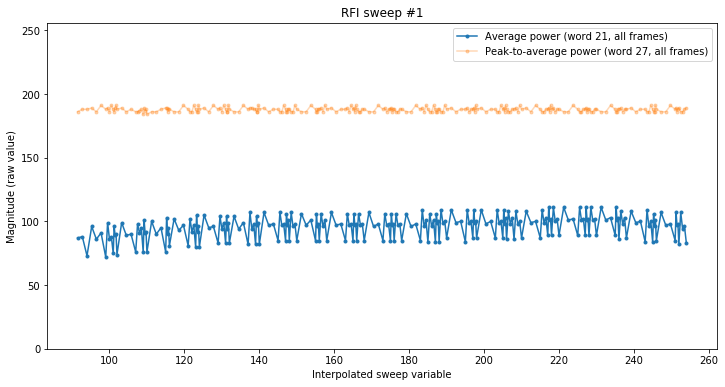
Sweeps with even number show a constant value. My interpretation is that these correspond to sweeps where the RFI instrument is used as a command receiver. Instead of sweeping frequency, the receiver is held at a fixed frequency. This explains the constant noise floor in the absence of any signals in this frequency.

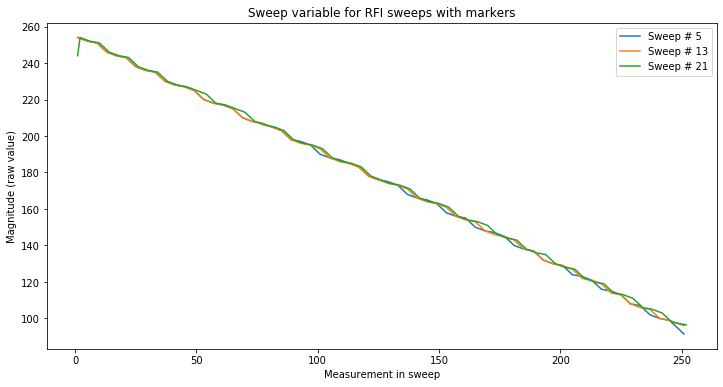
To investiagate the accuracy or repeatability of the RFI instrument sweeps, we overlay in the same plot the average power corresponding to the three sweeps with frequency markers that were present in the data I have used. We see that the tones don’t line up particularly well.
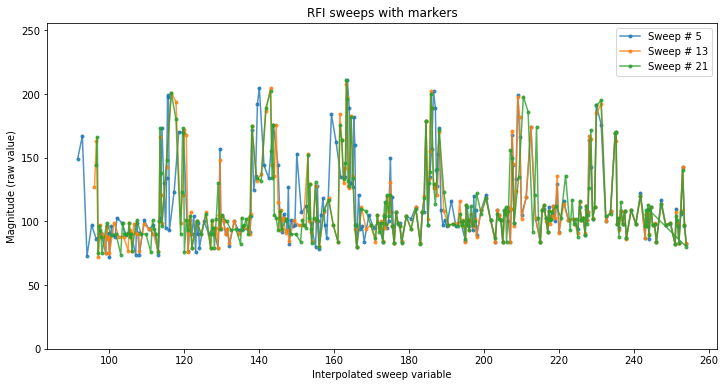
If instead of plotting the data against the value of the interpolated sweep variable we ignore the sweep variable and plot the data against the measurement number in the sweep, we see that the markers line up much better (note that the spectrum is inverted left to right).
The figure below shows the evolution of the value of the sweep variable across the sweep in each of these three sweeps. We see that its behaviour is not very repeatable, especially near the end of the sweep. Thus, I find questionable the accuracy of this variable, or even its true purpose.
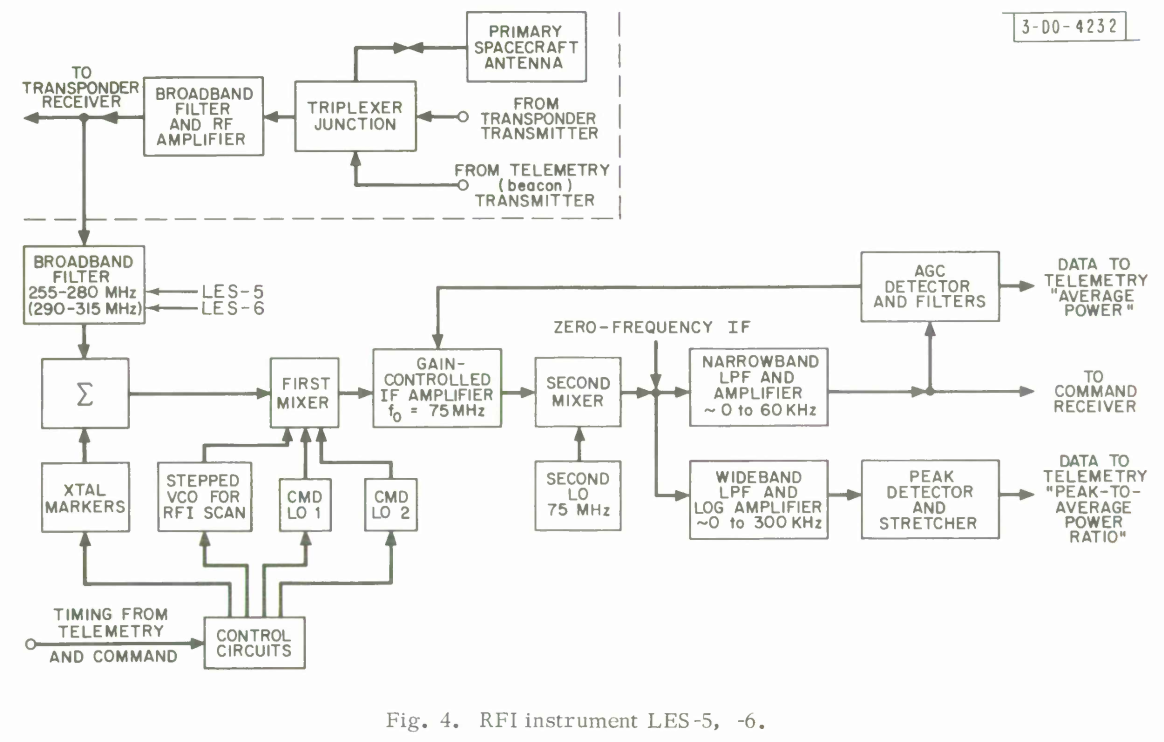
The absence of signals in the RFI sweeps is interesting. This might be simply because there were no strong signals in the passband when the data was collected. Another likely possibility is that part of the receiver has deteriorated or failed with time. The figure below shows the block diagram of the RFI instrument. Since the crystal markers are seen correctly in the telemetry, it seems that most of the receiver is working more or less well. The problems may be somewhere between the antenna and the hybrid coupler (represented as Σ in the diagram). Since the telemetry transmitter is working fine, probably the antenna and triplexer are fine. The most likely point of failure is the broadband RF amplifier.
In any case it seems that in Taylor’s tweet there are signals present in some of the RFI sweeps (and in one of the command receive sweeps). It may happen that the receiver is only somewhat deaf, rather than completely deaf.
By now we have lots of data that Scott has collected over the last days. Examining and plotting these in the light of the findings shown in this post may tell us more about the state of the RFI experiment. It is somehow astonishing that after almost 53 years in orbit the RFI experiment continues working quiet well.
In particular, the report on the results of the experiments describes a problem whereby the RFI receiver would only work correctly for 5 hours in each 22 hour orbit. The remaining 17 hours the instrument swept twice as fast, so the measurements were unreliable. It was believed that this was caused by some kind of interaction between the command and control logic and the Earth and Sun sensors. I haven’t seen this anomalous behaviour in the data I have examined. It may be that the recording was made in the good 5 hours. Another possible explanation is that the problem has disappeared somehow (maybe the culprit Earth and Sun sensors have failed).
Thanks for the very interesting evaluation!
With no basis in the data, but rather pure speculation, I wonder if:
#1, any of the inconsistencies observed might be due to loss of on-board crystal stability due to age & the amount of protection available from the elements utilized so long ago?
-and-
#2, if the “absence of signals in the RFI sweeps” might partially be due to less traffic on that portion of the 200 MHz band than was fashionable when this satellite was launched?