The Hermes-Lite 2 and other SDR transceivers based on the openHPSDR protocol support sending bandscope data from the SDR to the PC. The bandscope data consists in fixed-length chunks of samples taken directly from the ADC. Since the ADC in a DDC receiver runs at a high sampling rate, by taking the Fourier transform of these chunks, the bandscope data can be used to display a spectrum or waterfall of a huge frequency range, covering all the HF bands. In the case of the Hermes-Lite 2, the ADC samples at 76.8MHz, so the bandscope data gives us a spectrum from 0 to 38.4MHz.
Note that the the chunks of the bandscope data are not contiguous. Streaming samples at 76.8MHz from the ADC into the PC continuously would be a lot of data. Thus, a chunk is taken and stored in the FPGA and then sent to the PC slowly. Therefore, bandscope data is only intended for wideband spectral analysis and probably has very little use outside of that.
By recording and processing the bandscope data, one can produce plots similar to the full day waterfall from the University of Twente WebSDR. Here I describe my first tests using Python.
The first thing to note is that the Hermes-Lite 2 (and most openHPSDR transceivers) does not have any onboard memory, so a complete chunk of samples has to be stored in the FPGA before being sent to the PC. This puts an upper limit on the chunk size we can use, and therefore it also limits the spectral resolution obtained in the plots.
The EP4CE22 Cyclone IV FPGA used in the Hermes-Lite 2 only has 594Kbits of memory. At 16 bits per sample this gives us room for 37125 samples. If we restrict our FFT size to a power of 2, it might be possible to fit 32768 samples with a lot of effort (since the memory is also needed for other functions). The largest FFT size (or chunk size) that we can get without too much effort is 16384. At a sample rate of 76.8MHz this gives us a frequency resolution of 4687.5Hz per bin. This is a bit poor. For instance, the SDR in UTwente uses 2kHz per bin. Still, this performance is amazing for a general purpose and low-cost SDR such as the Hermes-Lite 2.
The default firmware for the Hermes-Lite 2 uses a chunk size of only 2048 samples for the bandscope. It was reduced to make room for other functionality. I have modified the firmware to use a chunk size of 16384. To fit this in the FPGA, I had to remove other functionality. I’m not an expert on FPGAs, so probably it can be done better, but my general strategy to try to fit the larger bandscope FIFO has been to reduce the number of slice receivers and to reduce the size of other FIFOs until everything fitted.
My modifications to the firmware are in this patch in case anyone else wants to try. My patch was made against this git revision (there is already a newer version of the default firmware).
To record the bandscope data, I have decided to use tcpdump or similar to record the UDP packets sent by the Hermes-Lite instead of talking to the Hermes-Lite and implementing the whole protocol. This approach is much simpler and it also lets me use simultaneously the radio normally in another software.
I have started a new Github repository, hl2-bandscope, with my bandscope recording and processing software. The bandscope_record.py script uses pcap to capture the bandscope UDP packets. Then it assembles the chunks of 16384 samples, computes the FFT of each chunk, takes the modulus squared to obtain spectral power-density, averages over 436 chunks and saves the results to a file. I have chosen to do the FFT and averaging in this script to prevent the output file from growing quickly, as it happens if you save all the bandscope data.
The averaging window of 436 chunks has been chosen to give approximately one average per minute (which is the same as the UTwente WebSDR uses). I don’t know if the bandscope chunks are sent from the Hermes-Lite with a precise timing, or rather when the Ethernet controller can (I suspect the second). Another approach to choose the averaging window would be to use the timestamps of the captured UDP packets or the computer clock and average all the chunks received in one minute. Using a fixed number of chunks is more simple and seems good enough.
The plot_image.py script reads the file generated by bandscope_record.py and uses Matplotlib to generate an image. I usually keep bandscope_record.py running continuously and run plot_image.py whenever I want to view the progress. Note that some SDR software must be using the Hermes-Lite 2 while bandscope_record.py runs, to make the Hermes-Lite send UDP packets to the PC. In my case, I’m using Quisk.
I have been recording the bandscope data continuously for 5 days. The results can be seen in the figure below (click to view in full size). The complete 8193×6871 image can be downloaded here (54MB).
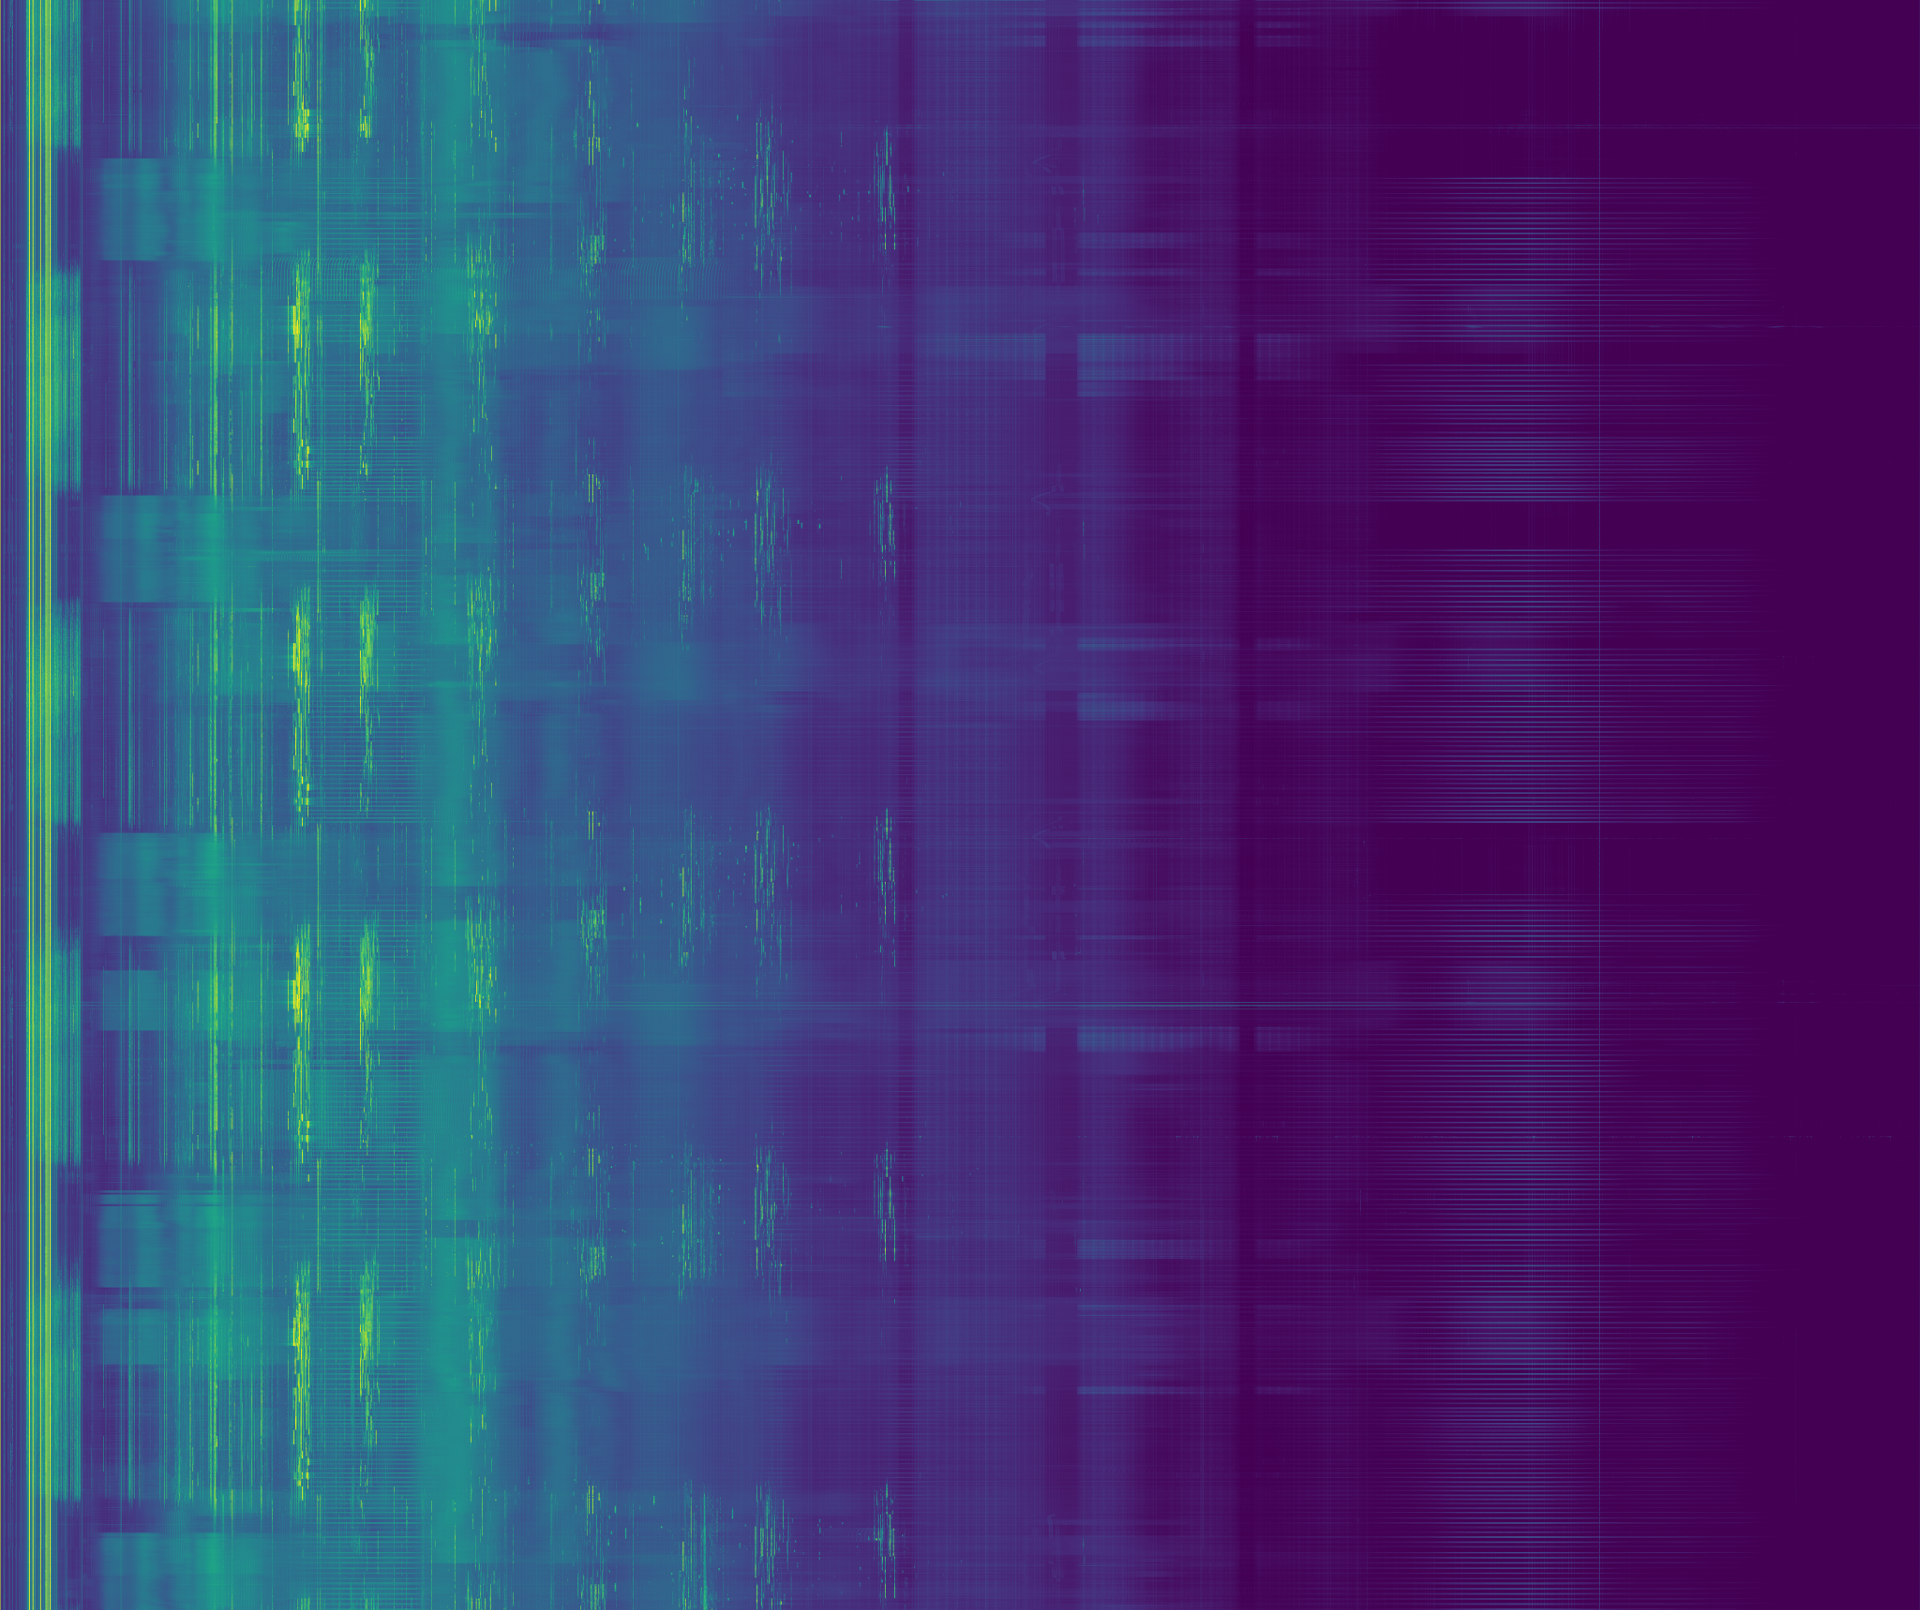
The analysis of this image is perhaps a job for another post.
Hi!, Hermes-Lite it’s an standalone board, or need the rest of the modules in HPSDR project like original hermes??
Thanks
It’s a standalone board for a complete 5W HF transceiver. The only thing missing is a set of lowpass filters for transmit (there are several boards for this or you can use a linear amp with its own lowpass filters).