Yesterday I posted about my decoding of some recordings of the X-band telemetry of Tianwen-2 done by the Dwingeloo radio telescope. Today I have some small updates.
First of all, I have figured out the format of the AOS insert zone. In the previous post I mentioned that the AOS insert zone contains 8 bytes that are mostly static, except for one byte that seems to be a frame counter. I suspected that the AOS insert zone would contain timestamps, which was the case with Tianwen-1, but this didn’t seem to be the case with Tianwen-2. However, today I have found that the 8-byte insert zone contains a 6-byte timestamp in little endian format that counts the number of \(2^{-16}\) second ticks since the epoch, which is 2019-12-31 16:00:00 UTC (or 2020-01-01 00:00:00 Beijing time). The remaining two bytes have the constant value 0x300b. I don’t know what these two bytes are, since they don’t seem to be a CCSDS time code P-field.
There were two things about this timestamp field that were confusing me: the fact that it is little-endian, since CCSDS and the telemetry data in the Space Packet payloads is always big-endian, and the fact that these AOS frames take exactly one second to transmit. This means that the change in the timestamp in each frame is just an increment in the byte corresponding to seconds, which carries over to the next bytes on overflows, plus a very slow drift in the least significant byte caused by the relative drift of the symbol rate clock and the spacecraft clock. Only now that I’ve seen how this field evolves during longer periods of time, I have been able to figure its format.
Using an epoch in Beijing time instead of UTC is common in Chinese spacecraft. For instance, Tianwen-1 uses 2016-01-01 00:00:00 Beijing time as its epoch.
The second update is that AMSAT-DL has been tracking Tianwen-2 with their 20 m dish in Bochum and decoding the telemetry signal in real time with SatDump. They have shared the decoded AOS frames with me, and I have run them through my Jupyter notebook. They have collected a good amount of data: a few hours on May 26 and a full track of about 10 hours on May 27. This data is what has given me the clues to figure out how the timestamps work. The following plot shows the APIDs received over time. This indicates that there are no APIDs that are only active occasionally.
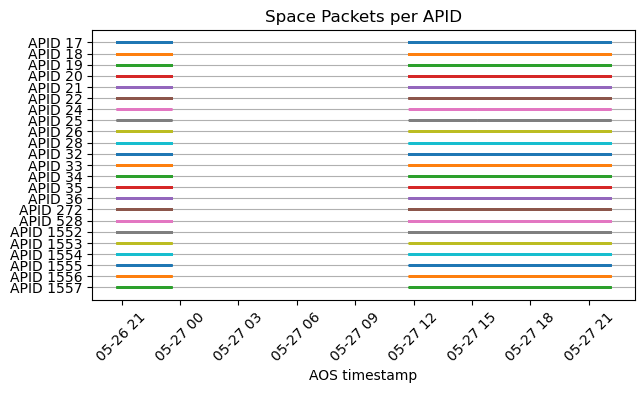
Even though now we have a much longer time span of data, the qualitative behaviour of the telemetry is still the same as I mentioned in the last post. The Jupyter notebook where I analyse the frames received by Bochum is here.