In a previous post, I described the remote sensing orbit into which Tianwen-1 had moved on November 8. Now it has been in this orbit for more than one month, and AMSAT-DL has been collecting telemetry almost daily with the 20 metre antenna at Bochum obseratory. Therefore, it is a good moment to review the state vector data and look at how the orbit has evolved with time.
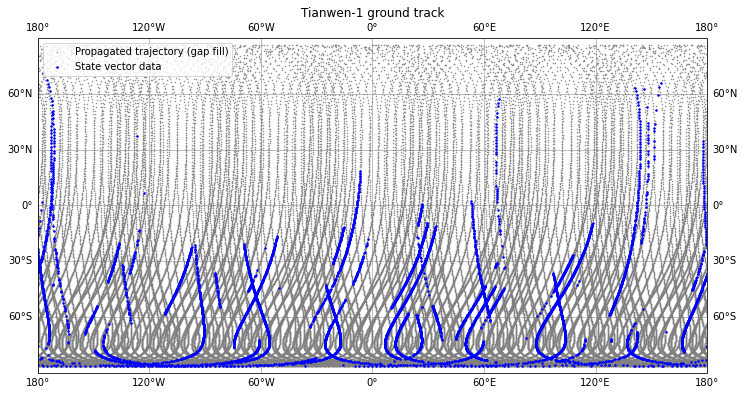
The technique I have used to study the data has been basically the same as in this post. GMAT is called from a Jupyter notebook using its Python API to propagate the time gaps between the state vectors that Bochum has decoded, thus obtaining a continuous trajectory that follows the state vectors. The figure below shows the ground track, with the state vector data marked in blue and the propagated trajectory marked in grey. It is no coincidence that most of the received state vector data is in the southern hemisphere. Since the periapsis is on the northern hemisphere, Tianwen-1 spends most of the time over the southern hemisphere.
The next figure shows the orbit radius versus time. The periapsis and apoapsis radiuses have stayed almost constant.

Recall that the remote sensing orbit has a period which is approximately 140 seconds longer than 2/7 Mars sidereal days. This means that the ground track almost repeats every 2 Mars sidereal days, after 7 revolutions, but shifted a few degrees to the west.
The figure below tries to show this behaviour. It depicts the longitudes of the equator crossings (nodes) of the orbit. The nodes of each revolution are given a colour according to the orbit number modulo 7, so there are a total of 7 colours. The ascending node and descending node of the same revolution are marked with the same colour. As usual, we consider that the revolution starts at the periapsis. Since the periapsis is above the equator, the descending node happens before the ascending node of the same orbit.
Ascending nodes are marked with a triangle pointing up, and descending nodes are marked with a triangle pointing down. Triangles of the same shape and colour are joined with a line to show clearly the drift to the west of the nodes. Besides this, there is a dotted line that joins all the nodes in chronological order, to make it possible to see the order in which they happen.
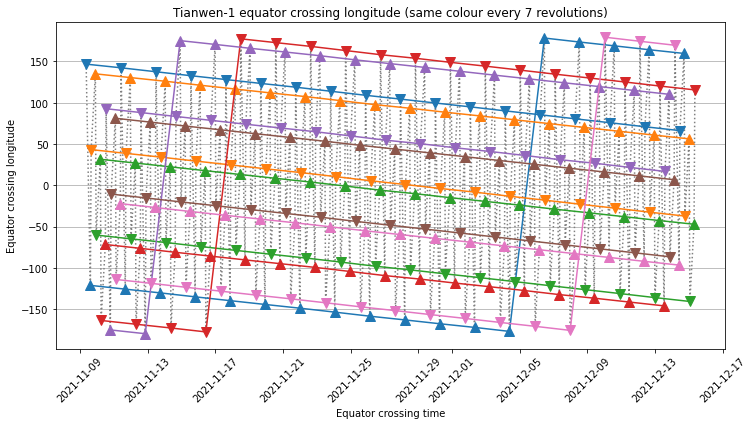
In the plot we can see that the longitude of the descending node of one revolution is quite close to the longitude of the ascending node of the next revolution. Grouping the nodes in pairs like so, we get 7 groups which are equispaced by 51.43 degrees. The groups drift slowly to the west. In slightly over 20 days, the drift has accumulated to 51.43 degrees and so the groups have shifted places. The consequence of this is that the whole surface of Mars is scanned every 20 days.
The next figure shows the ground track according to the elevation at which Tianwen-1 can be seen from the rover Zhurong. Points where the spacecraft is above 30 degrees elevation are shown in green. These are good for communications between the rover and orbiter. Points where the spacecraft is above the horizon but below 30 degrees are shown in orange. For these, communication might be possible, but perhaps not recommended. Finally, points for which the spacecraft is below the horizon are shown in black. Additionally, the nodes of the orbit are marked as in the previous plot.
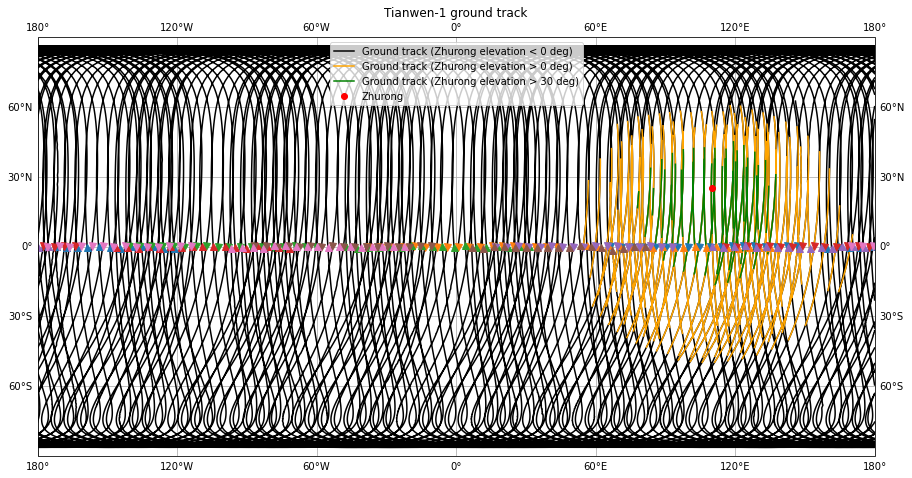
Since the plot is rather busy, it is better to show only the first 10 days of data, which is done below.
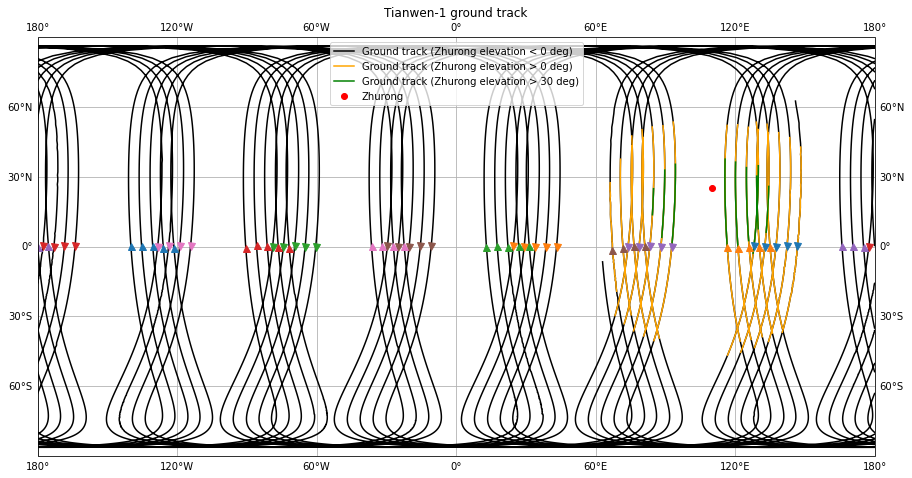
We see that if only the passes that have a maximum elevation over 30 degrees are used for communications, then typically only 2 communications passes will be possible every 2 Mars sidereal days. In the plot shown above, on the first day we have the ascending orange node and the descending purple node as possible communications passes on the first few days. Eventually the purple node drifts too far west, but more or less at the same time the blue descending node drifts in and starts being useful for communications. If the lower elevation passes are also used for communications, then up to 4 communications passes will be possible every 2 Mars sidereal days (blue, orange, purple and brown in the figure).
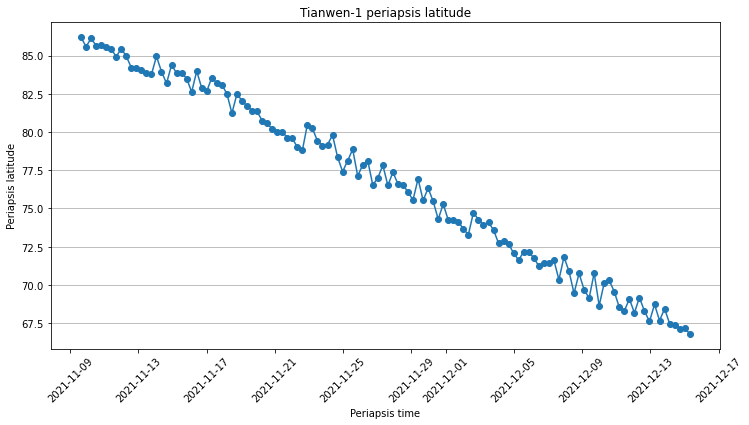
In the previous post I commented about a news article that explains that the latitude of the periapsis keeps changing due to orbital perturbations. First it moves from north to south, and then it will move from south to north again. This allows the orbiter to eventually scan all the surface of Mars from a low altitude, which is necessary for high detail.
The figure below shows how the periapsis latitude changes with time. We see that in some 36 days it has decreased by about 18 degrees, which gives a rate of 0.5 degrees per day. Therefore, in order to cover all the surface of mars around a year will be needed so that the periapsis can move from the north to the south pole.
The calculations and plots for this post have been done in this Jupyter notebook. As shown by the additional plots there, the periapsis and apoapsis radiuses, and hence the orbital period have stayed quite constant for all this time.
2 comments