On November 8, the Tianwen-1 orbiter made a manoeuvre to move itself to the remote sensing orbit, as reported by Chinese media. This orbit is the final orbit in the mission, as depicted in this figure from Wikipedia. The main goal of this orbit is to study the geophysical properties of Mars with all the orbiter instruments (see this paper) and to continue acting as a communications relay for the rover Zhurong.
As usual, AMSAT-DL has been collecting telemetry from Tianwen-1 with the 20 metre antenna at Bochum observatory, including spacecraft state vectors. This allows us to study the orbit change manoeuvre and the properties of the remote sensing orbit. This post is a first look at the state vector data.
The last state vector received by AMSAT-DL before the orbit change manoeuvre was:
2021-11-08 10:21:08.224700 -1514.7500329949896 5445.415055351603 1023.398127898517 0.38327883545518154 -2.0631665185917996 2.482739708978983
Shortly after receiving this state vector, the telemetry signal was lost at Bochum, probably due to the spacecraft changing to the low gain antenna for the orbit change manoeuvre.
The first state vector received by AMSAT-DL after the orbit change was already on the next day:
2021-11-09 10:42:09.169800 1786.3925178639424 -3521.8603918686213 -12884.286672718548 -0.21100179119659598 0.9822409035982982 -0.7303411191821157
The orbital parameters before the orbit change were:
- Inclination: 86.3 deg
- Period: 1/3 Mars sidereal day + 114 seconds
- Periapsis altitude: 407 km
- Apoapsis radius: 15895 km
- RAAN: 104.9 deg
- Argument of periapsis: 94.0 deg
The parameters of the new orbit are
- Inclination: 86.3 deg
- Period: 2/7 Mars sidereal days + 170 seconds
- Periapsis altitude: 275 km
- Apoapsis radius: 14138 km
- RAAN: 104.8 deg
- Argument of periapsis: 88.4 deg
There are several things to note here. The first is that since the beginning of September, the periapsis has moved north and was almost over the north pole before the orbit change. In September the argument of periapsis was 121.8 deg (see this post), so it has changed by 27.8 deg. We have also seen that the periapsis moved north between June and September (it was roughly over the equator in June). In principle, we don’t know whether this movement of the periapsis was caused by manoeuvres or by natural orbit perturbations, since we don’t have a continuous time series of data from Bochum (due to the dish motors failing in June and the Mars solar conjunction in October).
The second remark is that the orbit period is very close to 2/7 of a Mars sidereal day. This gives a ground track that repeats every 2 Mars sidereal days, after 7 revolutions, and so it is good for scheduling communications with the rover (and probably also for some remote sensing tasks).
This news article gives more information about these things. I’m using Google translate to read it, so some details might not be completely accurate. The article states that remote sensing with high resolution can be achieved from low altitude, and that the periapsis moves in latitude due to orbital perturbations. First it moves from south to north, and then from north to south. Due to this movement, all the surface of Mars can be surveyed from a low altitude.
This south to north movement is just what we have been seeing between June and November, so it seems that the cause is natural perturbations. To understand this better, it might be interesting to revisit the techniques I used for the analysis of Longjiang-2’s elliptical lunar orbit perturbations, though in that case the main perturbing force was Earth’s gravity. In this case it will be either the non-spherical gravity of Mars, the gravity of the Sun, or a combination of both.
The article also mentions that the orbiter does 3.47 revolutions per “day” (understood as a Mars sidereal day). This is a bit less than 3.5 = 7/2, and agrees with the fact that the period we are seeing is slightly larger than 2/7 sidereal days. Arguably, this difference in period from the nominal 2/7 sidereal days could be corrected with station keeping manoeuvres, and in fact we have seen such deviations in the reconnaissance and communications orbits, which were station kept to pass over the rover’s location. However, the period slightly longer than 2/7 sidereal days is probably intended, and would agree with the 3.47 revolutions quoted in the article. This would cause the ground track to slowly drift west, at a rate of 4.8 degrees per 2 sidereal days (or 7 revolutions), giving equal coverage to all the surface of Mars. This advantage of a non-repeating ground track is also mentioned in the article.
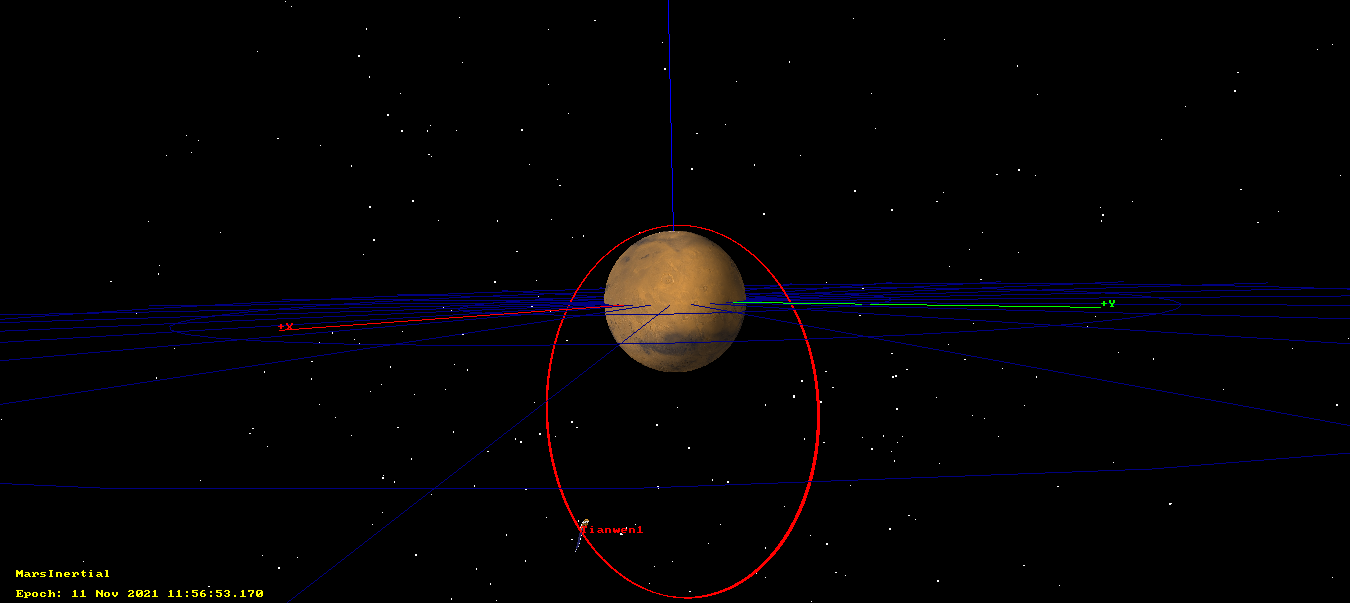
The remote sensing orbit is shown in the figure below in inertial coordinates. We see that the periapsis is almost over the north pole of Mars.
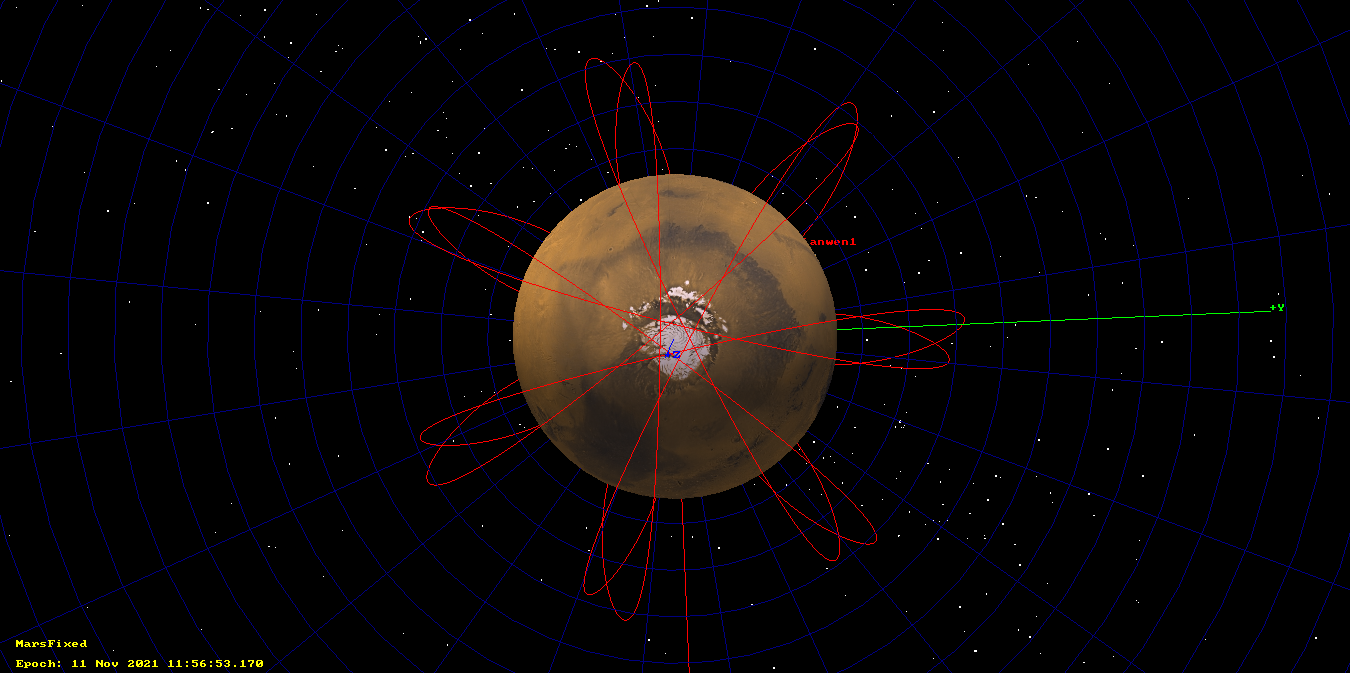
In Mars-fixed coordinates the orbit is repeating (or almost repeating). After 7 revolutions the spacecraft is close to where it started. The orbit roughly traces some of the diagonals of a heptagon. In particular, there are seven longitudes along which the spacecraft descends from north to south or ascends from south to north. The figure below shows the view from the north pole.
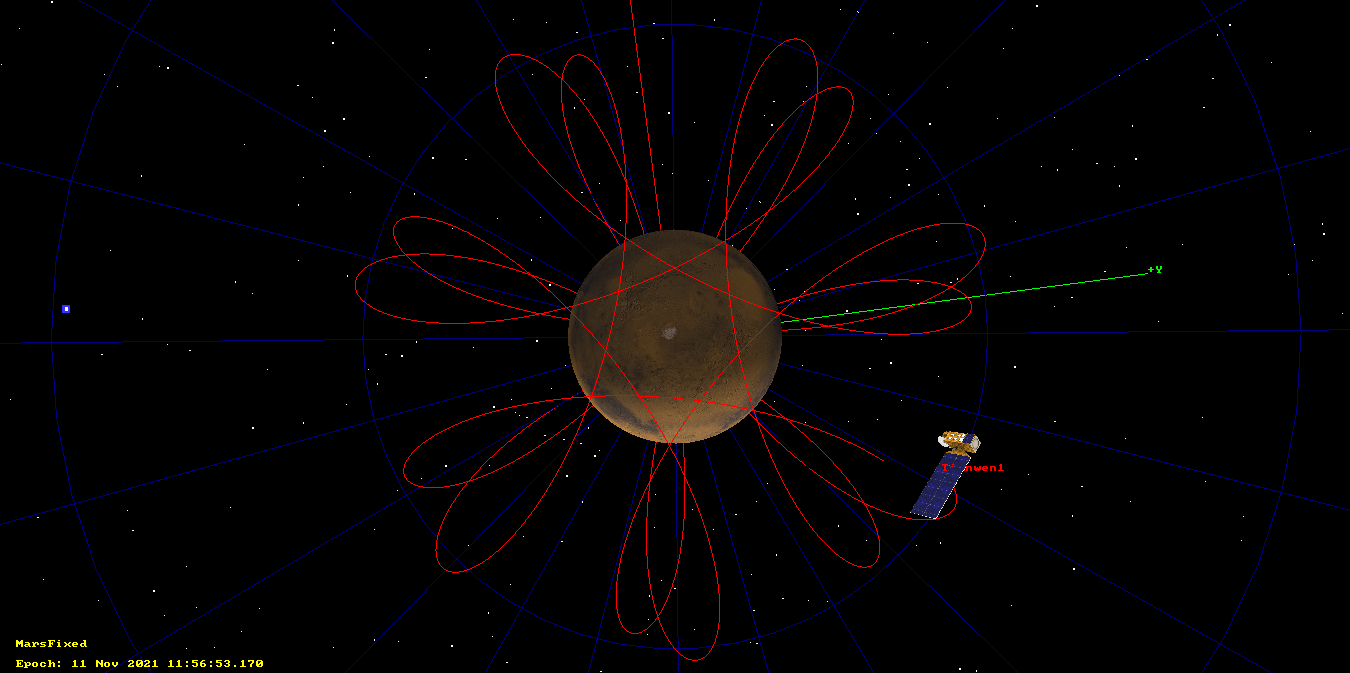
The view from the south pole shows a similar heptagonal pattern.
The ground track shows the seven longitudes along which the spacecraft ascends and descends. Presumably the ground track would drift west at a rate of 4.8 degrees per 2 Mars sidereal days.

Let us call “tracks” these seven longitudes along which the spacecraft ascends and descends. Currently, the rover Zhurong is more or less in the mid point between two of these tracks. The separation of 360/7 = 51.4 degrees between adjacent tracks is probably small enough that the rover can use the passes along its two closest tracks to stablish communications with the orbiter. If these is true, the number of potential communication sessions would be 4 for each 2 sidereal days.
As usual, I have compared the pre-burn and post-burn state vectors with the goal of measuring the delta-v of the burn. In this situation where both the periapsis and apoapsis altitudes have changed, in principle it would be possible to have two burns: one around periapsis, to lower the apoapsis, and one around the next apoapsis, to lower the periapsis. Since there is a gap of roughly one day (which corresponds to more than 3 revolutions) in the data collected by Bochum, we wouldn’t be able to distinguish the effects of each of the burns separately.
However, this doesn’t seem to be the case. The trajectory propagated forwards with the pre-burn state vector and the trajectory propagated backwards with the post-burn state vector intersect roughly at the time when the first burn would happen. This supports the idea that only one burn was made. The figure below shows the distance between the pre-burn and post-burn trajectories. There is a clear intersection at 11:30:02 UTC (spacecraft event time), where the minimum distance of 2.7 km is achieved.
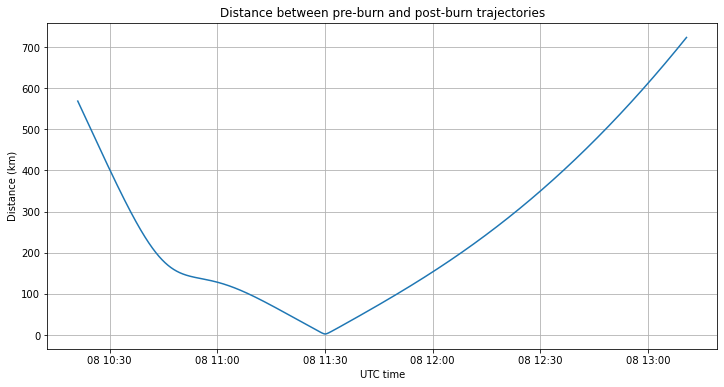
This places the single burn at 11:30 UTC. The periapsis was passed at 10:49 UTC.
According to the change in the velocity vector of these trajectories, the magnitude of the delta-v was 81.1 m/s. This matches quite well the figure of 78 m/s given in this news article. The delta-v vector in Mars-centric body inertial coordinates was
[-14.52, 36.69, 70.86] m/s
In the VNB frame this gives
[-80.45, -0.09, -10.32] m/s
As expected, the burn happened in-plane, since N is close to zero. Most of the burn went into the -V component, in order to lower the apoapsis. However, there is also a noticeable component of the burn along the -B vector. The effect of burning along -B is, roughly speaking, to lower the half of the orbit following the burn and raise the half of the orbit preceding the burn. In this case it might happen that if only a burn along -V was done to lower the apoapsis, then the final periapsis altitude would be too low. In any case, for this kind of single-burn transition between orbits, the location of the burn and the delta-V vector needs to be assessed carefully to choose the optimal manoeuvre, so it’s not easy to explain why this orbit change was done in this particular way without further study.
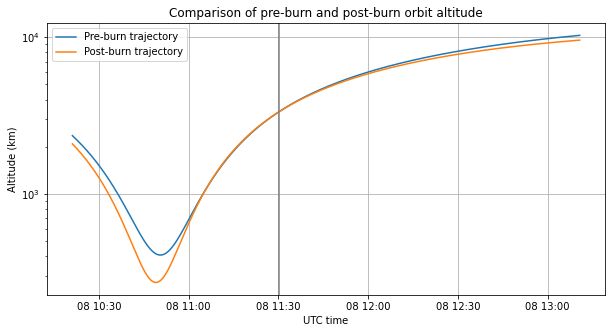
The plot below compares the orbit altitude of the pre-burn and post-burn trajectories, in an span of a few hours around the burn, which is marked with a vertical line. The altitude is shown in a logarithmic scale. The two trajectories intersect at the burn, but elsewhere the post-burn trajectory is always lower than the pre-burn trajectory.
Since I’ve lost track of the mass of the orbiter after the rover was released, it isn’t easy to estimate the burn duration or the fuel spent. The news say that four 120 N thrusters were used for 260 seconds, so assuming a specific impulse of 321.6 s, that would give a spacecraft mass of around 1600 kg, and a fuel consumption of 41 kg.
The GMAT script used for the calculation of the pre-burn and post-burn trajectories can be found here. The remaining computations and plots have been done in this Jupyter notebook.
3 comments